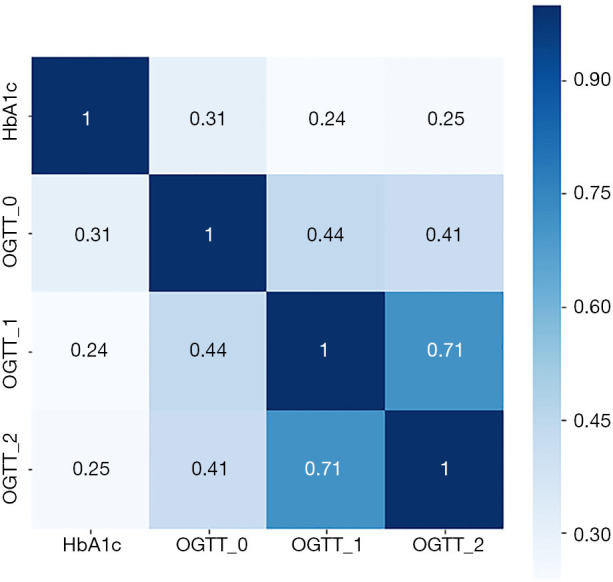
Figure 2.

Pearson correlation matrix with numerical coefficients showing a degree of similarity between glycated hemoglobin (HbA1c), oral glucose tolerance test (OGTT) 0 h, OGTT 1 h, and OGTT 2 h levels. The scale shows a color gradient for the correlation coefficient values from 0 to 1.
