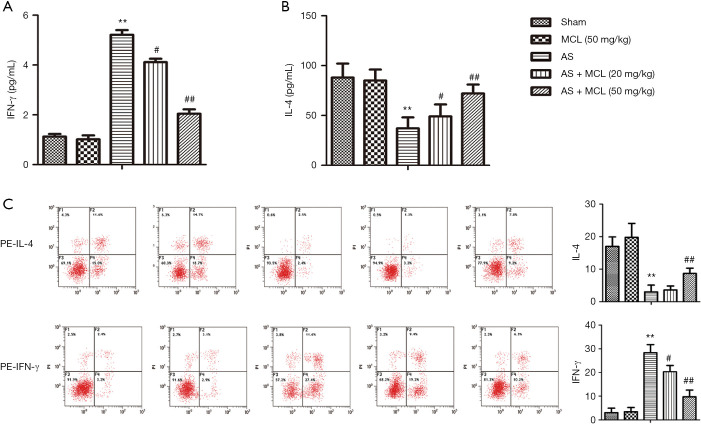
Figure 3.
MCL down-regulated IFN-γ levels and up-regulated IL-4 levels in the AS model. The protein expression levels of IFN-γ and IL-4 were detected by ELISA and flow cytometry, respectively. (A) IFN-γ (pg/mL), (B) IL-4 (pg/mL), (C) representative flow cytometry plots for IL-4 and IFN-γ. The results are presented as mean ± SD and represent three individual experiments. **, P<0.01 versus sham group; #, P<0.05, ##, P<0.01 versus AS model group.

