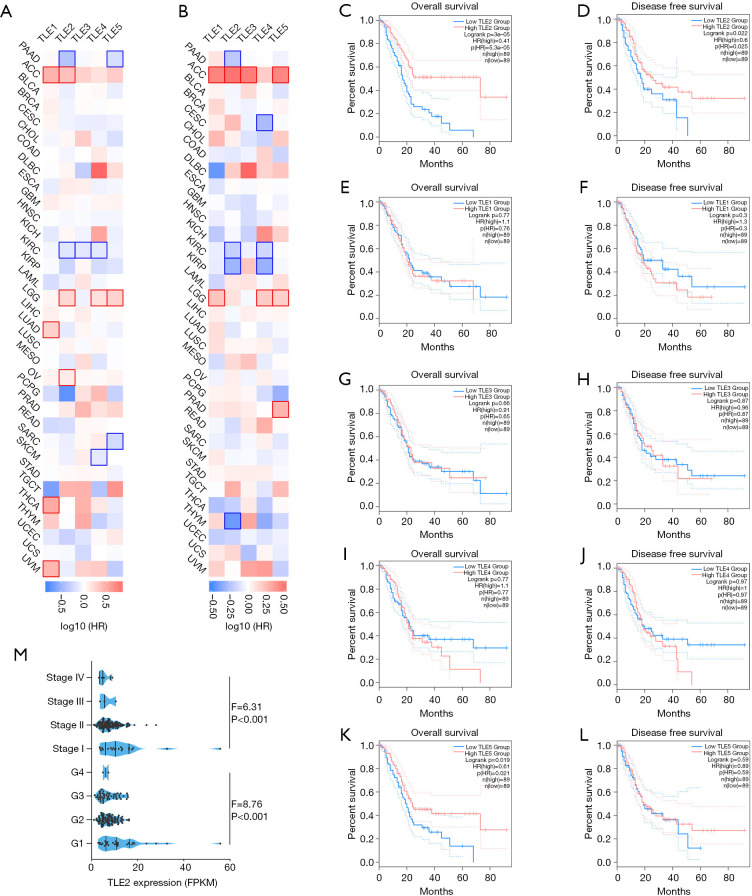
Figure 1.
Prognostic value of members of TLE family across cancers. (A) The relationship between TLEs and OS across multiple cancer types. (B) The relationship between TLEs and DFS across multiple cancer types. (C,D,E,F,G,H,I,J,K,L) Patients in the TCGA-PAAD cohort were stratified by the median values of TLE expressions, the prognostic value of each TLE family member was evaluated by Kaplan-Meier survival curves with the log-rank test. The figure was generated with GEPIA, as mentioned the methods above. (M) XXX. TLE, transducin-like enhancer of split; OS, overall survival; DFS, disease-free survival; TCGA-PAAD, the Cancer Genome Atlas portal; GEPIA, Gene Expression Profiling Interactive Analysis.

