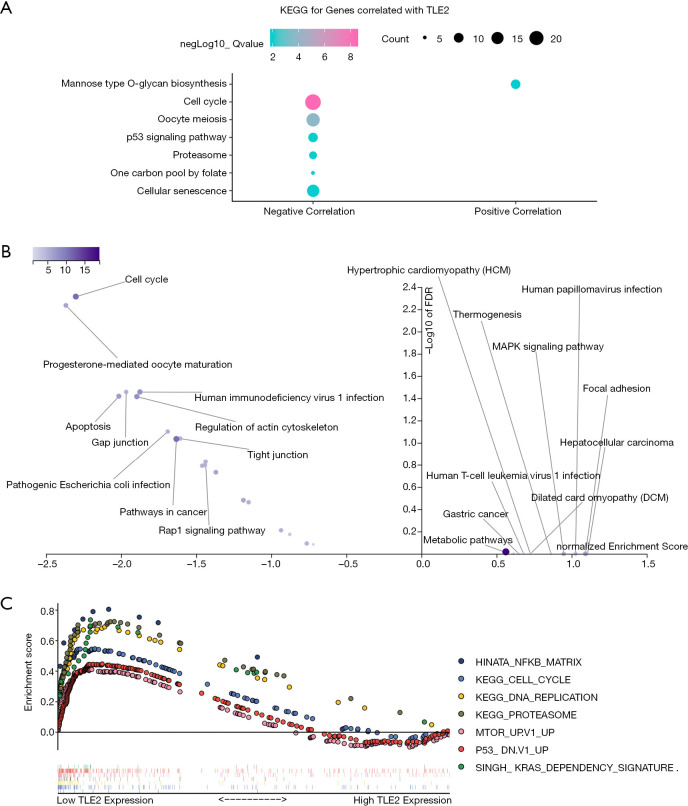
Figure 3.
Functional annotation and enrichment of key pathways associated with TLE2 expression in pancreatic cancer. (A) KEGG enrichment analysis of the genes most correlated with TLE2 was performed using the R package clusterProfiler. (B) KEGG pathway database enrichment analysis of the genes most correlated with TLE2 was performed using the WebGelstat tool. (C) The GSEA enrichment analysis results of the top KEGG pathways and oncogenic signatures in the TCGA pancreatic cancer samples according to TLE2 expression. The descriptions of the abbreviations of pathways are as follows: HINATA_NFKB_MATRIX, Matrix, adhesion or cytoskeleton genes induced by NF-kappaB in primary keratinocytes and fibroblasts; KEGG_Cell_Cycle, Cell cycle; KEGG_DNA_Replication, DNA replication; KEGG_Proteasome, Proteasome; MTOR_Up.V1_UP, Genes up-regulated by everolimus in prostate tissue; P53_DN.V1_UP, Genes up-regulated in NCI-60 panel of cell lines with mutated TP53; SINGH_KRAS_DEPENDENCY_SIGNATURE, genes defining the KRAS dependency signature. KEGG, Kyoto Encyclopedia of Genes and Genomes; GSEA, gene set enrichment analysis; TCGA, the Cancer Genome Atlas.

