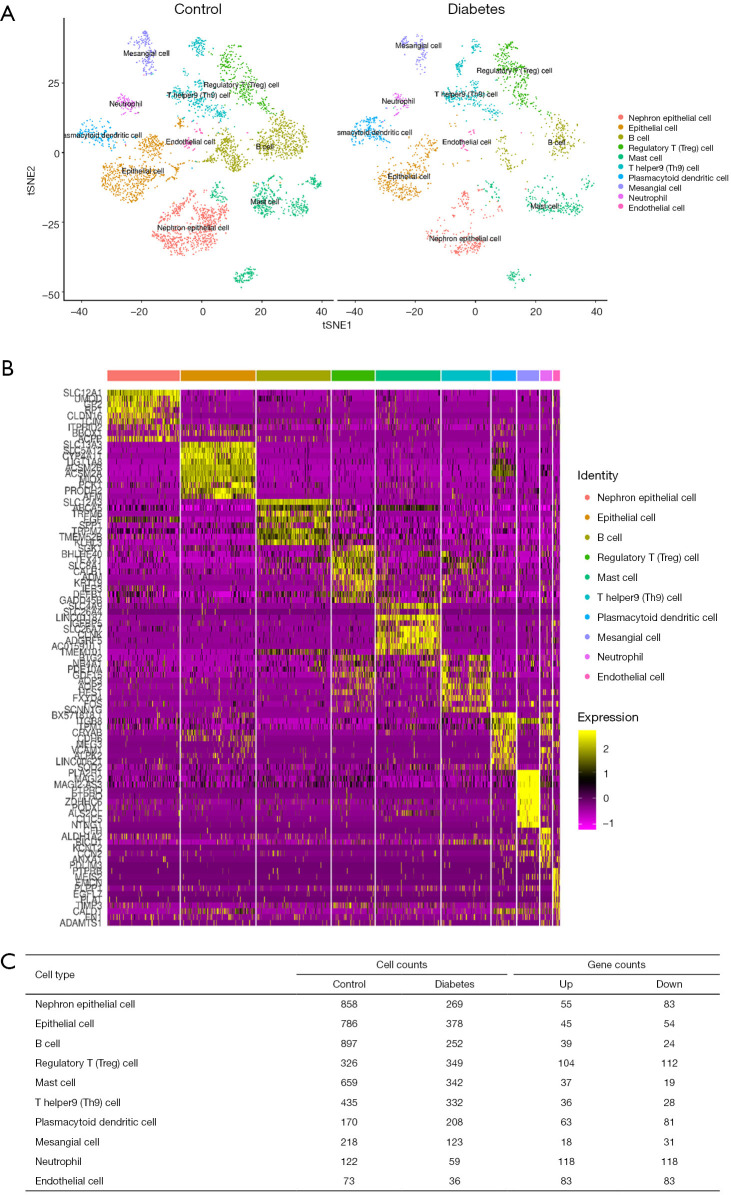
Figure 1.
Identification of DEGs in the GSE131882 datasets. (A) Cell types of each cluster in DKD samples and control samples. (B) The heatmap of the top 10 markers of gene expression in different cell clusters. (C) The DEGs in different cell clusters. DEGs, differentially expressed genes.

