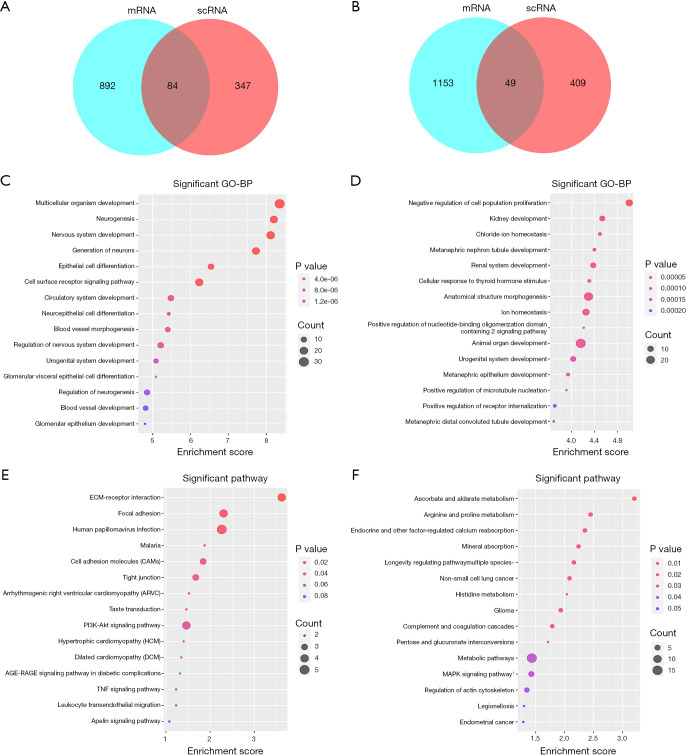
Figure 3.
Functional enrichment analysis of DEGs. (A,B) Venn diagram of selected upregulated DEGs (A) and downregulated DEGs (B). (C,D) GO enrichment result of DEGs. The x axis represents the gene ratio, and the y axis represents the GO terms. (E,F) KEGG enrichment results of upregulated DEGs (E) and downregulated DEGs (F). The x axis represents the gene ratio, and the y axis represents the KEGG terms. The size of the circle represents the gene count. The different colors of circles represent different adjusted P values. DEGs, differentially expressed genes; GO, Gene Ontology; KEGG, Kyoto Encyclopedia of Genes and Genomes.

