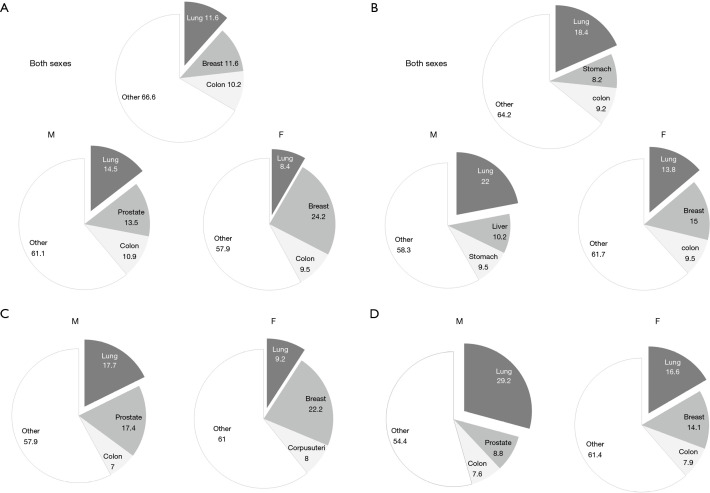
Figure 1.
Distribution of new cases and the deaths for three most common cancers in the World [2018] and in Poland [2014]. The pie charts present each cancer proportion of all cancers. (A) Global incidence, (B) global mortality, (C) incidence in Poland, (D) mortality in Poland. M, male; F, female (10,11).

