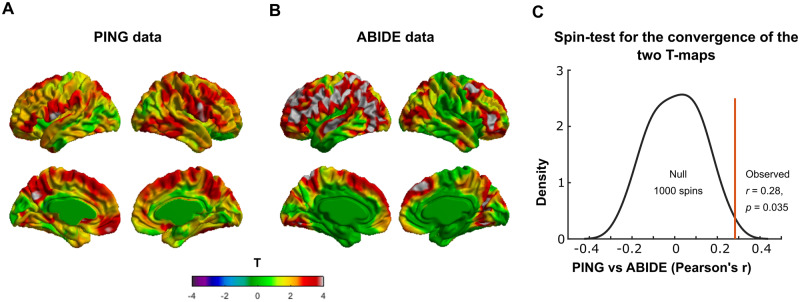
Figure 3.
Overlap of the ‘map of Age2 × PRS on cortical thickness in PING’ and the ‘map of Age3 × Group on cortical thickness in ABIDE’. (A) T-map of Age2 × PRS interaction on cortical thickness in the PING dataset. (B) T-map of Age3 × Group interaction on cortical thickness (groups: ASD and CTL) in the ABIDE dataset. (C) Spin test for statistically checking the regional overlap between the two maps using PING and ABIDE datasets. Note that using 1000 surface-based rotations of the map using PING, we found that the observed cross-vertex correlation of the PING and ABIDE maps (r = 0.29) was statistically greater (P = 0.03) that those with the 1000 rotations. Diagnostic groups = ASD and CTL; CTL = healthy controls.

