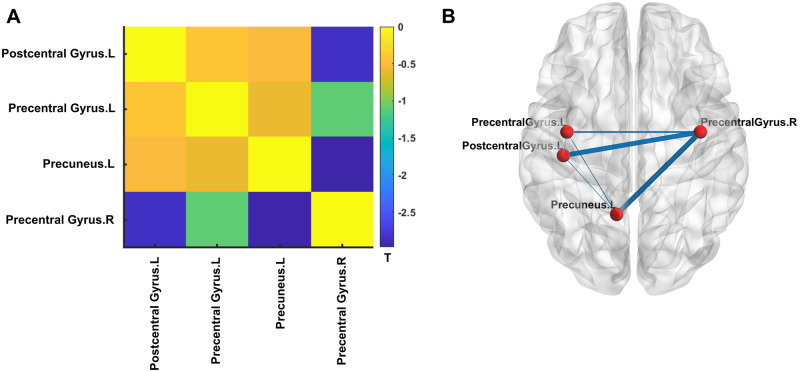
Figure 4.
Association of PRS for ASD and structural connectivity. (A) Matrix of the t-statistics for the association of PRS-ASD and structural connectivity for the four DKT brain regions namely Postcentral Gyrus.L, Precentral Gyrus.L, Precuneus.L and Precentral Gyrus.R (see ‘Materials and methods’ section). Note that all connections show negative correlation with PRS. Of the total six connections (corresponding to four regions), only two (namely Postcentral Gyrus.L—Precentral Gyrus.R and Precuneus.L—Precentral Gyrus.R) survived correction for multiple comparisons using false discovery rate at q = 0.05. (B) For better visualization, the t-statistics of the correlation of PRS for ASD and structural connectivity were visualized as edge weights between the four cortical regions (represented by the nodes) on a standard surface. DKT = Desikan–Killany–Tourville; L = left hemisphere; R = right hemisphere.

