Fig. 1.
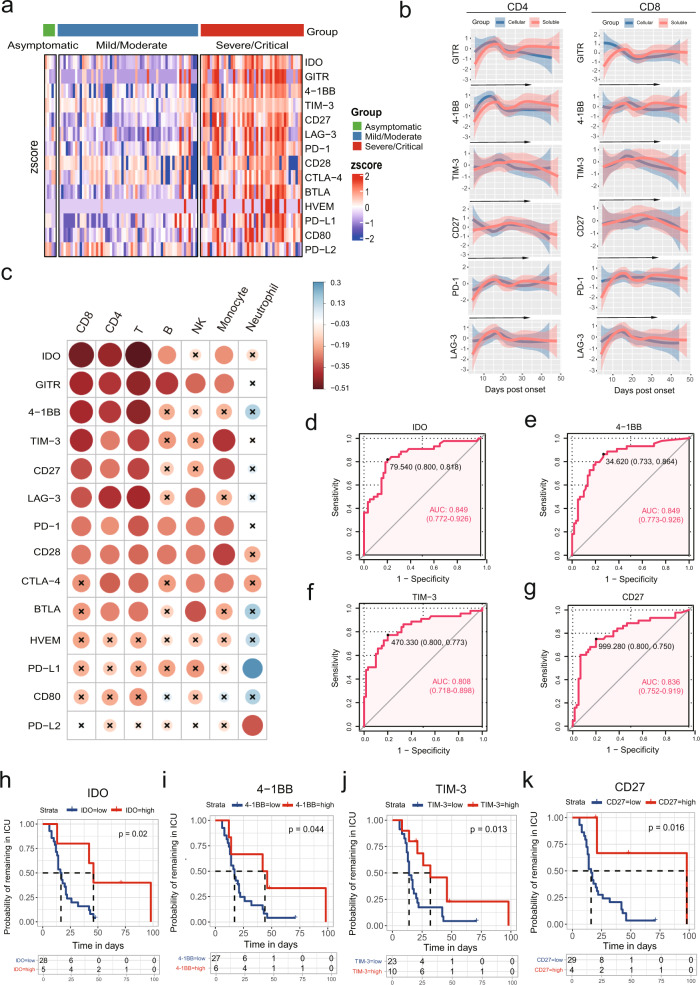
High level of soluble checkpoints correlated with severe illness in COVID-19 patients. a Heatmap depicting the relative serum levels of soluble checkpoint molecules in asymptomatic (n = 5), mild/moderate (n = 60), and severe/critical (n = 44) patients with COVID-19. Each column of the heatmap shows a patient, while the rows represent different molecules. Color scale in the heatmap represents scores standardized across rows. b The lines of best fit showing temporal changes of soluble and membrane-bound checkpoints in six severe/critical patients during hospitalization. The 95% confidence interval (CI) indicated by colored areas. c Correlation heatmap of peripheral blood leukocyte subsets and soluble checkpoints concentrations (data are log-transformed) at baseline. Data shown are representative of 72 patients with complete data. The circle size is proportional to the correlation coefficient value. Blue circle: positive correlation; red circle: negative correlation; values with no significant correlation are marked with a black cross. d–g Receiver operating characteristic (ROC) analyses for soluble IDO (d), 4-1BB (e), TIM-3 (f), and CD27 (g) in COVID-19 patients (n = 104). h–k Kaplan–Meier survival plots stratified by serum levels of soluble IDO (h), 4-1BB (i), TIM-3 (j), and CD27 (k). The 44 severe/critical patients contributed a total of 33 ICU admissions. Among ICU survivors, the proportion of patients remaining in the ICU is shown according to their ICU stay time

