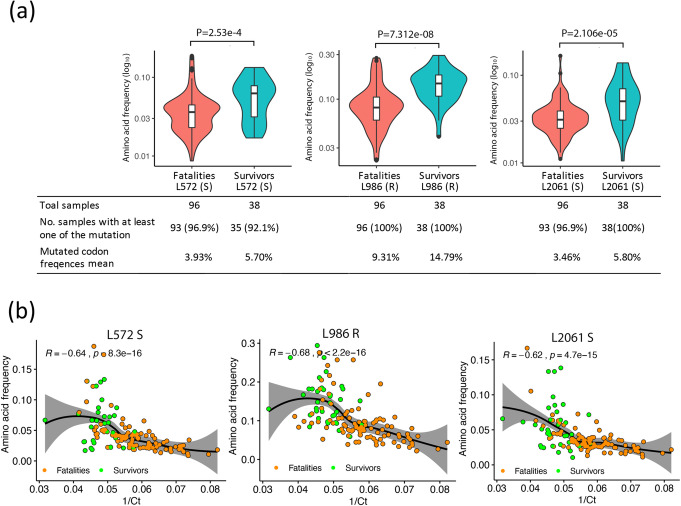
Fig. 4.
a Comparison of three amino acid variation frequencies in the L protein at positions 572, 986 and 2061. P values were calculated with the one-tailed Wilcoxon rank sum test. b A Spearman rank correlation test was used to estimate the correlation of these three amino acid variation frequencies with viral load (1/Ct) at positions 572, 986 and 2061, where the R value is the correlation coefficient ranging from − 1 (strong negative correlation) to + 1 (strong positive correlation), and P is the P value for this test. In a and b, only the samples with at least amino acid variation are shown

