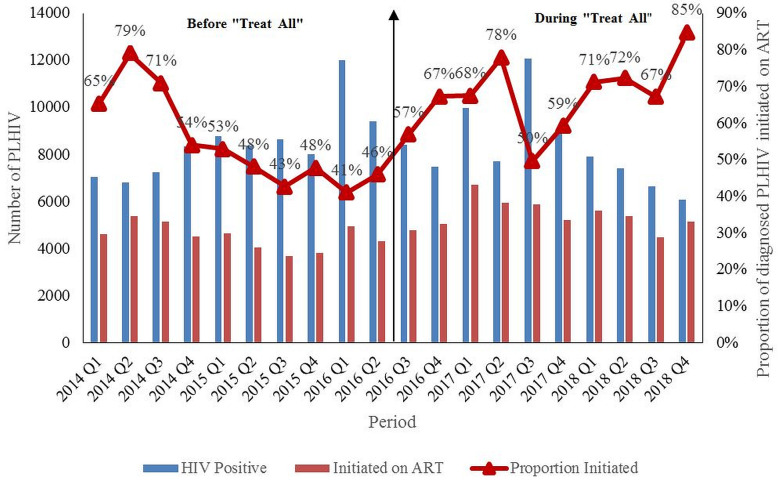
Figure 1. Trends # in quarterly ART uptake^ among newly diagnosed PLHIV before (January 2014–June 2016) and during (July 2016–December 2018) “Treat All” *, Harare, Zimbabwe.
PLHIV: People Living with Human Immunodeficiency Virus; ART: Antiretroviral therapy ^aggregate numbers for each quarter were extracted to calculate ART uptake, source of data is district health information system (DHIS-2) *” Treat All” means all individuals with confirmed HIV diagnosis are eligible for ART irrespective of WHO clinical stage or CD4 count. #During 2014, the CD4 count eligibility criteria was raised from <350 to <500 cells/mm 3 3. As more people in pre-ART care were eligible for ART, there was an increase in new ART initiations which resulted in corresponding increase in ART uptake. Similarly, there was an increase in new ART initiations which resulted in corresponding increase in ART uptake after “Treat All”.

