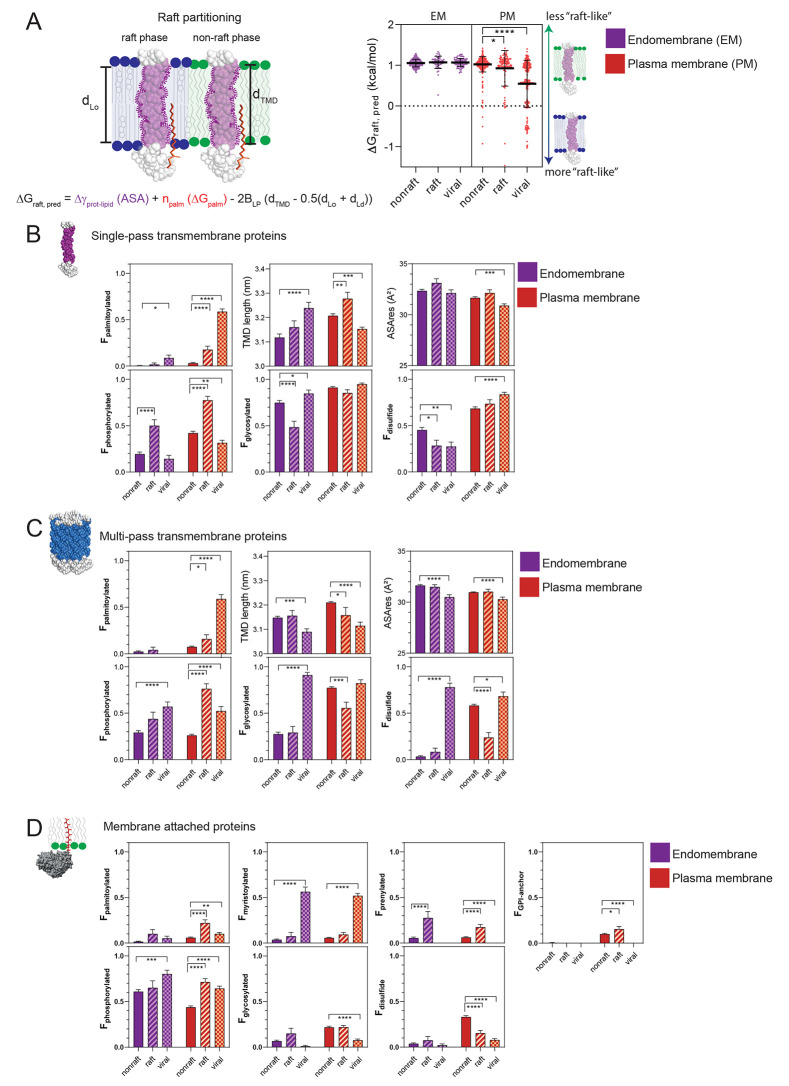
Figure 2.
Schematic of structural determinants and associated formula to predict the free energy (ΔGraft,pred) of raft partitioning according to Lorent el al.29 (A, left). Predictions have been made for single-pass transmembrane proteins in the nonraft, raft and viral database upon cellular localization (A, right). Membrane protein fractions (F) ± SEM containing structural modifications in the nonraft (full bars), raft (striped bars), and viral protein (squared bars) database upon localization in endomembranes (purple color) or the plasma membrane (orange color) (B–D). In addition, TMD length and accessible surface area/residue (ASAres) are determined for transmembrane proteins (B, C). Proteins are grouped upon single-pass transmembrane (B), multipass transmembrane (C), and membrane attached proteins (D). A two-way ANOVA test has been performed to compare the raft and viral proteins versus non raft data sets (*p < 0.05, **p < 0.01, ***p < 0.001, ****p < 0.0001).

