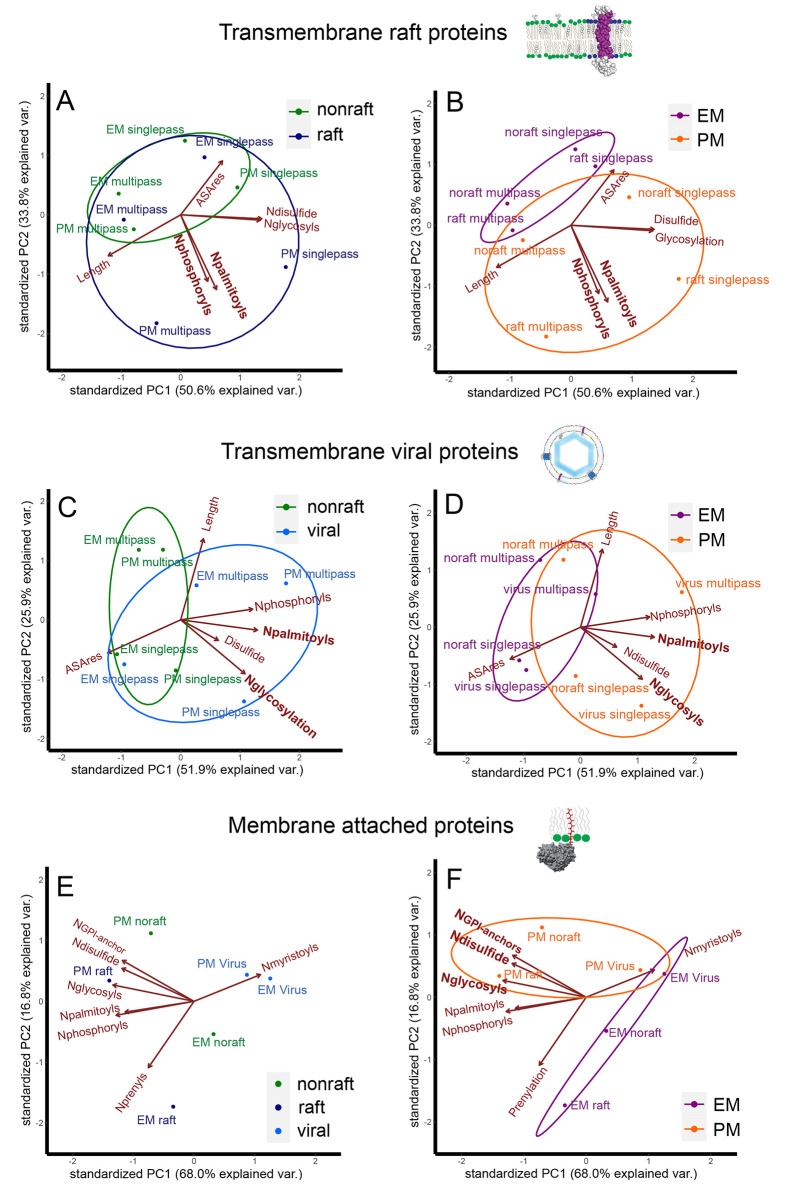
Figure 4.
Principal component analysis of the average number of modifications per protein (Nx/protein) in transmembrane (A–D) and attached membrane proteins (E, F), in raft versus nonraft (A, B) and virus versus nonraft (C, D) proteins. After PCA, proteins are colored upon protein type in the left column (green = nonraft, dark blue = raft, and light blue = viral) or cellular localization in the right column (orange = plasma membrane and purple = endomembranes).

