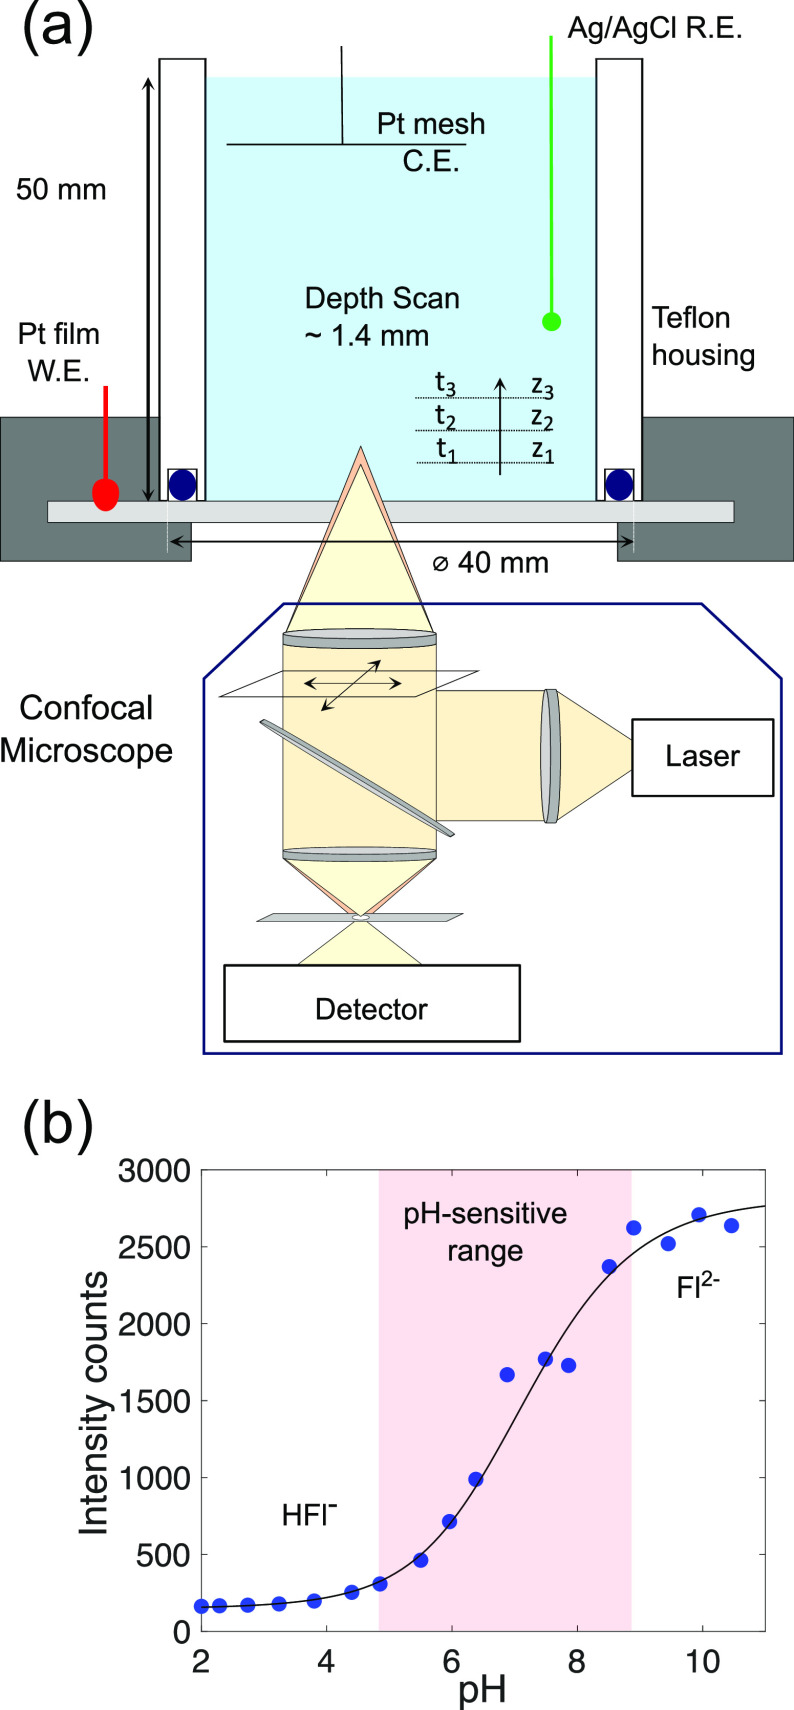
Figure 1.
(a) Schematic of the experimental setup. The electrochemical cell was placed on the inverted confocal laser scanning microscope. The transparent working electrode allowed for depth-wise (z) measurement of fluorescent intensity. (b) Calibration results for the pH dependence of fluorescein. The experimental data (filled circles) shown here are the mean of three measurements of intensity measurements at each pH (error bars are smaller than the marker size). A sigmoidal function (black line; see Supporting Information for details of fit) is fitted to all three measurements at each pH. The measurements were performed in 1 mM Na2SO4 containing 8 μM fluorescein. pH was adjusted to the required value by addition of H2SO4.

