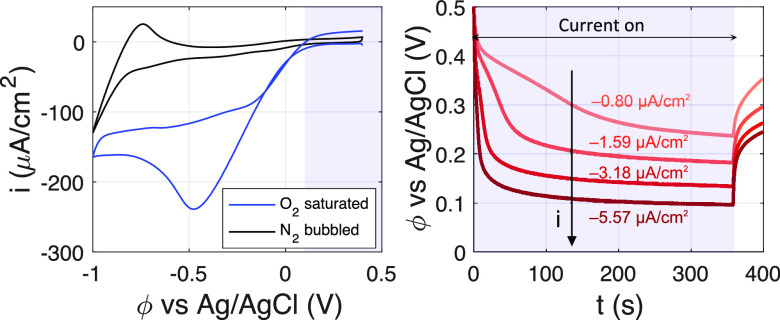
Figure 2.
Left: First cycle of the cyclic voltammogram (CV) measured at 10 mV/s for the Pt working electrode in O2 saturated and N2 bubbled solutions (pH 5 HClO4 + 0.5 M NaClO4 + 8 μM Fl) in our setup. The shaded region shows the potential range measured in chronopotentiometric (CP) experiments. Right: The CP curves obtained for the O2 saturated case. The shaded region indicates the time over which the constant current is applied. The corresponding current density for each curve is mentioned as well.

