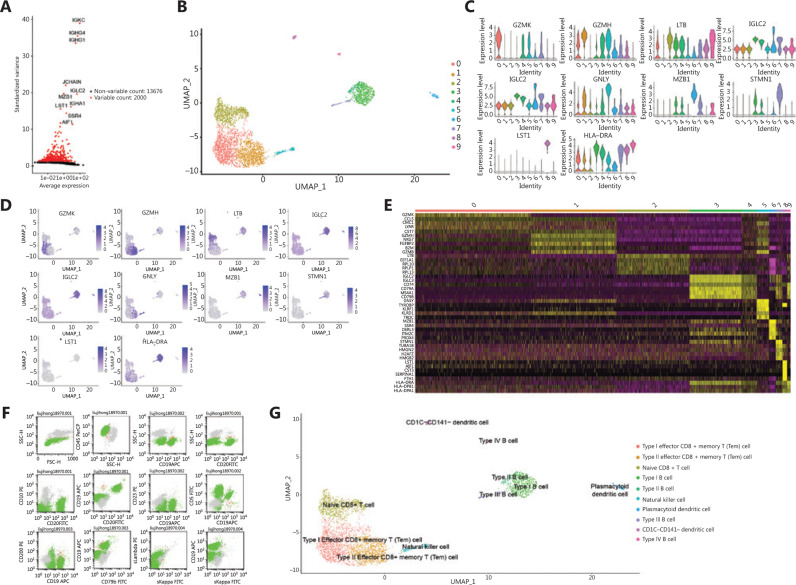
Figure 2.
Identification of cell subpopulations in the bone marrow of a patient with mantle cell lymphoma. (A) Characteristic genes with high variation. Red indicates genes with significant differences. (B) Clustering analysis of 10x single-cell transcriptome data from bone marrow cells in patients with mantle cell lymphoma (n = 3,989). Each dot represents a single cell and is colored according to cluster, as shown in the key. (C) Expression levels of selected markers, shown in a violin plot. The Supplementary Figure shows the expression levels of marker genes in different clusters. (D) Expression patterns of selected markers projected on the UMAP plot. Blue indicates high expression, and gray indicates low or no expression. For each cell type, one marker is shown in the main figures. (E) Expression heatmap of cell markers in each cluster. Each row represents a gene, and each column represents a single cell. (F) Detection of bone marrow by flow cytometry. Forward scattering (FSC) was used to characterize cell size. Side scattering (SSC) was used to characterize the complexity of cell particles. (G) Identification of cell cluster subpopulations.

