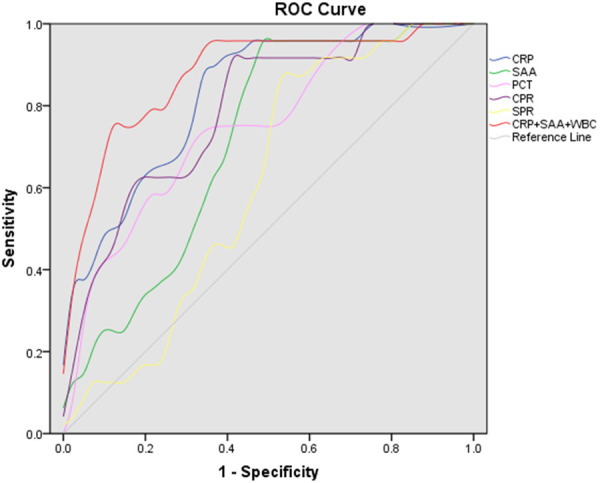
Figure 2.

The ROC curves for inflammatory indicators to predict the severity of disease in hospitalized patients. ROC curves were drawn for the different inflammatory indicators. The predictive probability of CRP and SAA levels, and white blood cell counts were calculated using logistic regression, and the corresponding combined ROC was plotted.
