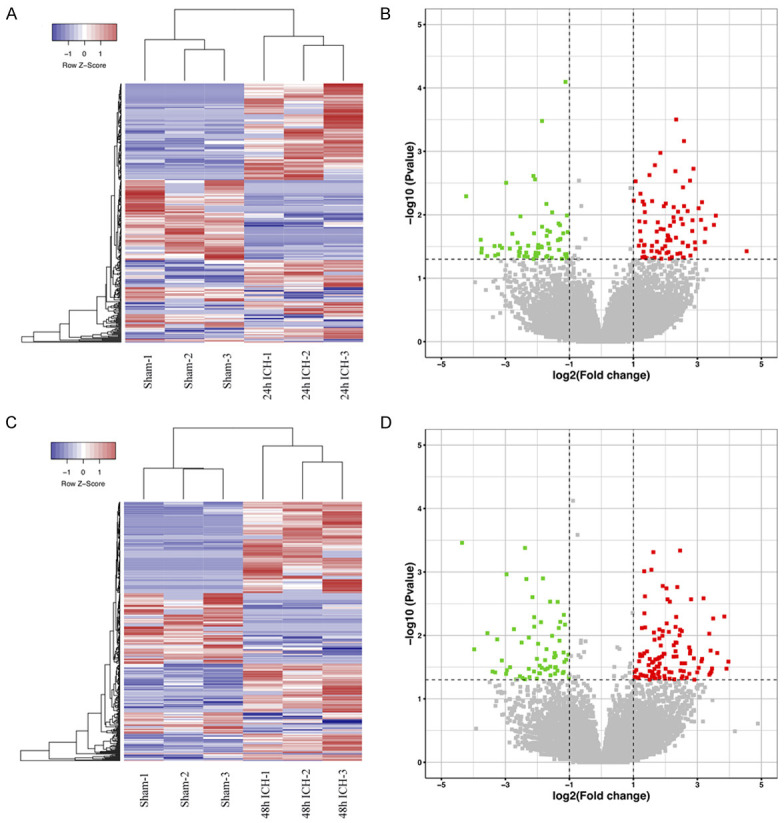
Figure 1.

The expression profile of circRNAs in the perihematomal brain tissue after ICH. The hierarchical clustering analyses of circRNAs differentially expressed at 24 hours (A) and 48 hours (C) after ICH compared with the sham group, “Blue” represents low intensity, and “Red” represents strong intensity. Volcano plots show all the detected circRNAs (sham vs. 24 hours (B) and sham vs. 48 hours after ICH (D)), the red points represent the differentially upregulated circRNAs, while the green points represent the differentially downregulated circRNAs (|log2 (fold change)| > 1, P-value < 0.05 (-log10 scaled)).
