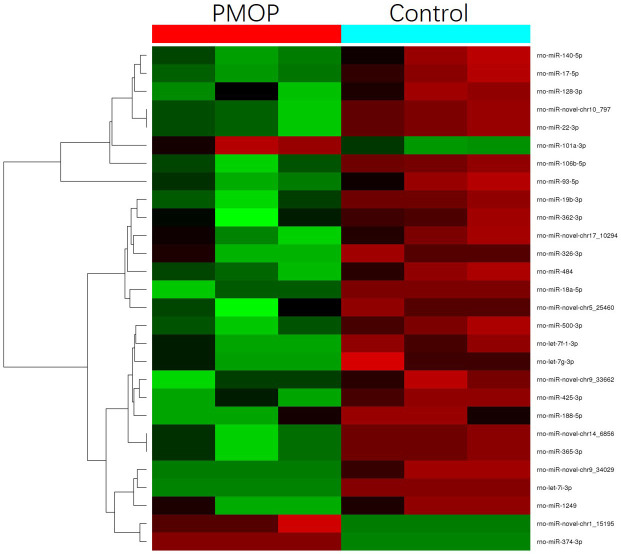
Figure 2.
Heat map and hierarchical clustering analysis of miRNA expression in rats with postmenopausal osteoporosis (PMOP) and healthy rats. MiRNAs were scaled according to the depicted color code. Each row represents a miRNA, and each column represents a sample. On the left is the miRNA clustering tree. The color scale illustrates the relative expression level of the miRNAs, the red color indicates upregulated miRNAs and the green color indicates downregulated miRNAs.

