
Figure 5.
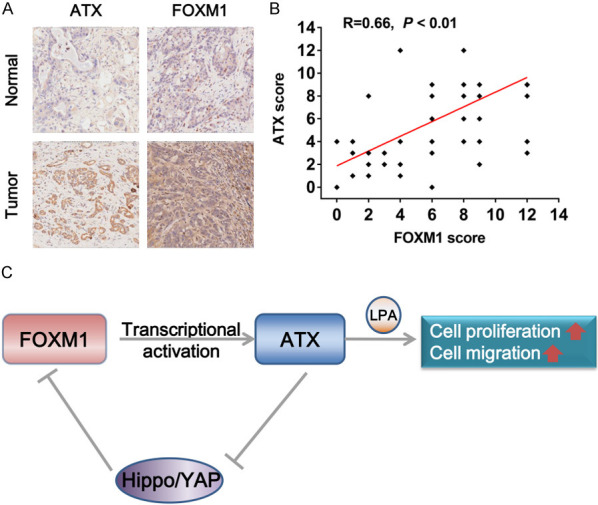
Positive correlation between FOXM1 and ATX expression in PDAC specimens. A. Representative IHC images of FOXM1 and ATX in PDAC tumor tissues and adjacent normal tissues were shown. Magnification: 200 ×. B. The correlation between ATX and FOXM1 expression in PDAC tumor tissues was analyzed using Pearson’s correlation coefficient analysis (n=90, R=0.66, P < 0.01), some of the dots represented more than one specimen. C. A model of the FOXM1/ATX positive feedback loop in PDAC was shown. FOXM1 transcriptionally activated ATX in PDAC cells, and ATX further promoted the transcriptional activity of FOXM1 by inhibiting the Hippo/YAP signaling, thus forming a positive feedback loop, which finally promoted PDAC cell proliferation and migration via inducing the production of its downstream oncogenic genes such as LPA.