
Figure 6.
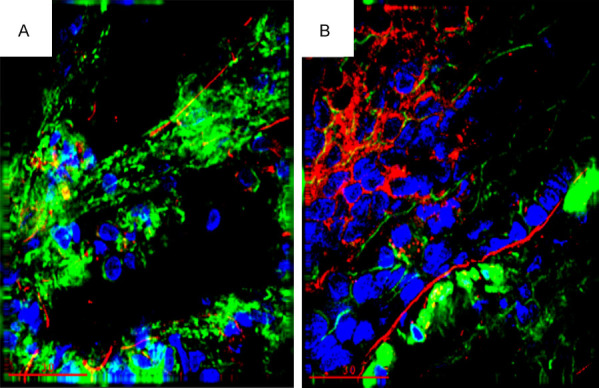
Increased TNF-α expression in lungs from the heart failure (HF) group (B) compared to the sham control group at 7 days (A). (green, F-actin; blue, Nuclei; red, TNF-α).
Official websites use .gov
A
.gov website belongs to an official
government organization in the United States.
Secure .gov websites use HTTPS
A lock (
) or https:// means you've safely
connected to the .gov website. Share sensitive
information only on official, secure websites.
Increased TNF-α expression in lungs from the heart failure (HF) group (B) compared to the sham control group at 7 days (A). (green, F-actin; blue, Nuclei; red, TNF-α).