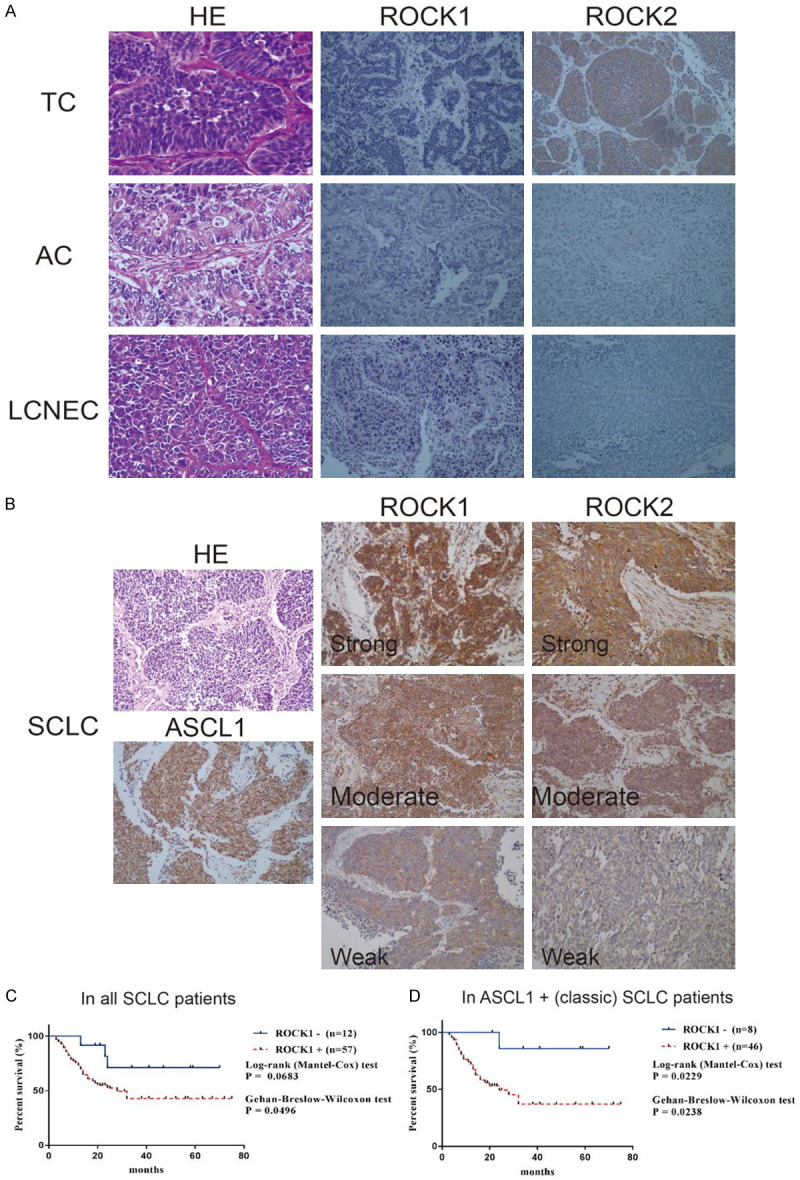
Figure 1.

Representative staining images and Kaplan-Meier analysis. (A) Representative HE staining (magnification × 400) and ROCK1/2 IHC staining for TC, AC, and LCNEC (magnification × 200) (B) HE staining of SCLC, positive IHC staining of ASCL1 in SCLC, and ROCK1/2 IHC staining image of strong, moderate, and weak cases (magnification × 200). (C, D) Kaplan-Meier analysis of ROCK1 in all 69 patients with SCLC (C) and in patients with ASCL1-positive (classic subtype) SCLC (D) indicated high expression of ROCK1 was related to poorer overall survival time.
