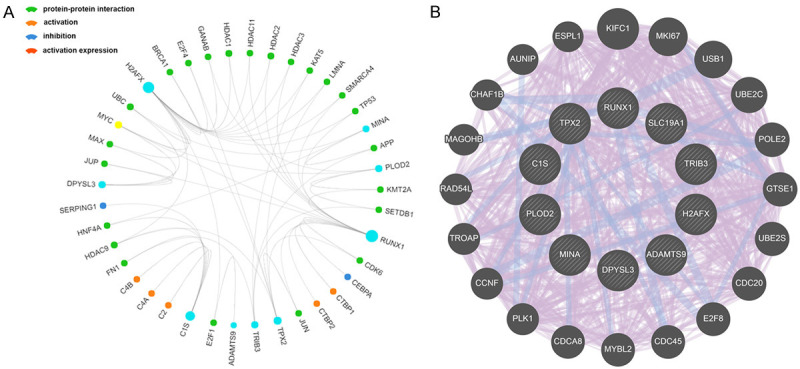
Figure 9.

PPI network of nodes from integrated prediction model. A. The most significant genes associated with ten hub genes and their relationship, including protein-protein interaction, activation, inhibition and activation expression, were visualized in a circos plot. B. A detailed PPI network related to this gene sets were constructed to show more interrelated nodes at protein level.
