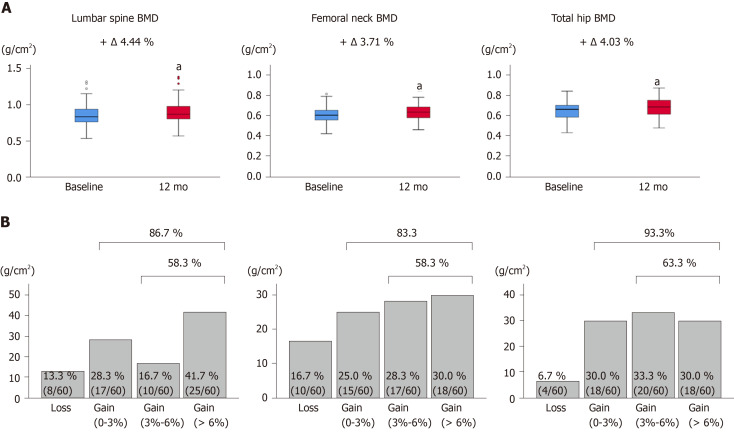
Figure 2.
Bone mineral density values and proportion of bone mineral density response categories based on the bone mineral density percentage changes. A: Bone mineral density (BMD) values at the lumbar spine, femoral neck, and total hip at baseline and 12 mo of denosumab treatment. Deltas and percentages represent median change rates from baseline to 12 mo. aP < 0.001 compared to baseline; B: The proportion of BMD response categories based on the BMD percentage changes from baseline to 12 mo of denosumab treatment at the lumbar spine, femoral neck, and total hip. BMD: Bone mineral density.

