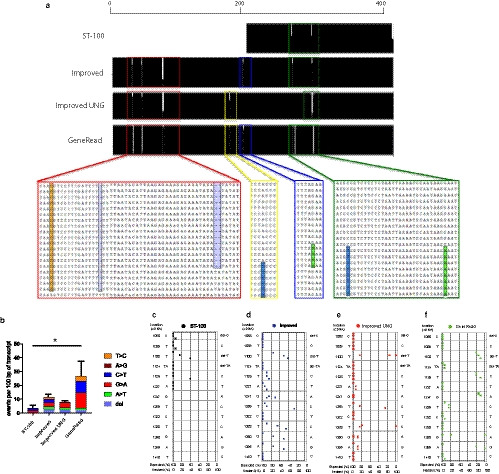
Figure 4.

Fidelity of amplicons determined by Sanger sequencing. (a) Aligned sequence of 20 subcloned amplicons from each method, showing loci of altered bases at several discrete loci. DNA from the ST‐100 method was only able to produce 200‐bp‐length amplicons. (b) The mean number of variations from the expected Ensembl human sequence per 100 bp. Error bars: mean and SEM. *p < .05. (c‐f) Percentage of subcloned transcripts showing expected or aberrant identities at each locus. Each dot represents a single technical replicate, each of 20 clones
