
Figure 7.
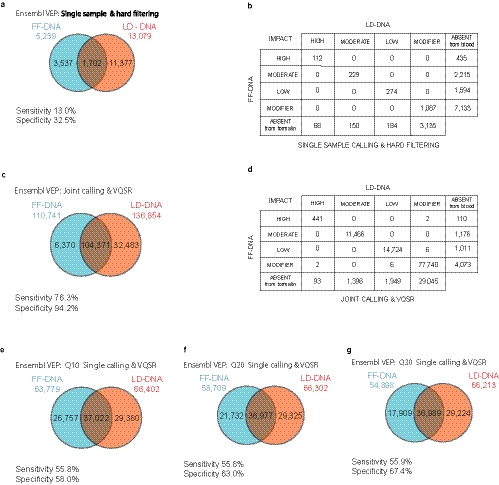
Comparison of GATK variant calling methods. (a) Venn diagram showing frequency of variants reported by Ensembl VEP after GATK pipeline with hard filtering. (b) Table comparing Ensembl VEP classification of variants between DNA samples in (a). (c) Venn diagram showing the effect of joint calling FF‐DNA and LD‐DNA with 216 exome catalogue. (d) Table comparing Ensembl VEP classification of variants between DNA samples in (c). (e‐g) Effect of increasing Phred Score on separate joint calling of FF‐DNA and LD‐DNA using 216 exome catalogue