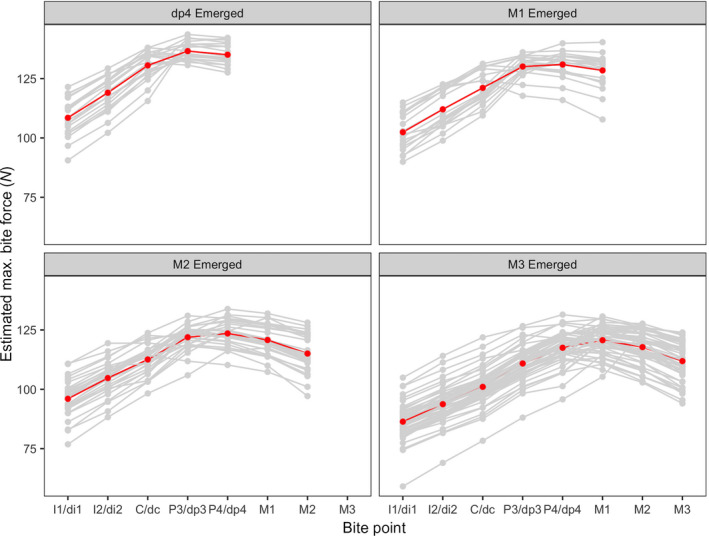
Figure 6.

Estimated bite forces using the Constrained Lever Model for four molar emergence categories. Individual bite force curves are shown in gray. Red bite force curves represent the average curve calculated from all individuals in each molar emergence category. Tooth abbreviations as in Table 1
