
Figure 5: Decoding reward distributions from neural responses.
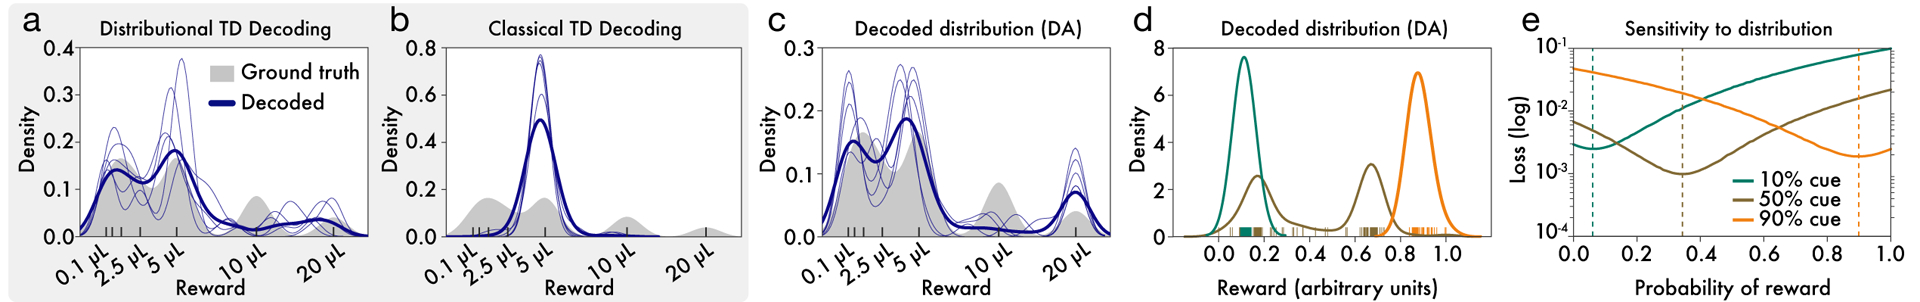
a, Distributional TD simulation trained on the variable-magnitude task, whose actual (smoothed) distribution of rewards is shown in gray. After training the model, we interpret the learned values as a set of expectiles. We then decode the set of expectiles into a probability density (blue traces). Multiple solutions are shown in light blue, and the average across solutions is shown in dark blue. (See Methods for more details.) b, Same as(a), but with a classical TD simulation. c, Same as (a), but using data from recorded dopamine cells. The expectiles are defined by the reversal points and the relative scaling from the slopes of positive and negative RPEs, as shown in Figure 5. Unlike the classic TD simulation, the real dopamine cells collectively encode the shape of the reward distribution that animals have been trained to expect. d Same decoding analysis, using data from each of the cue conditions in the variable-probability task, based on cue responses of dopamine neurons (decoding for GABA neurons shown in Extended Data Figure 8 i,j). e, The neural data for both dopamine and GABA neurons were best fit by Bernoulli distributions closely approximating the ground-truth reward probabilities in all three cue conditions.