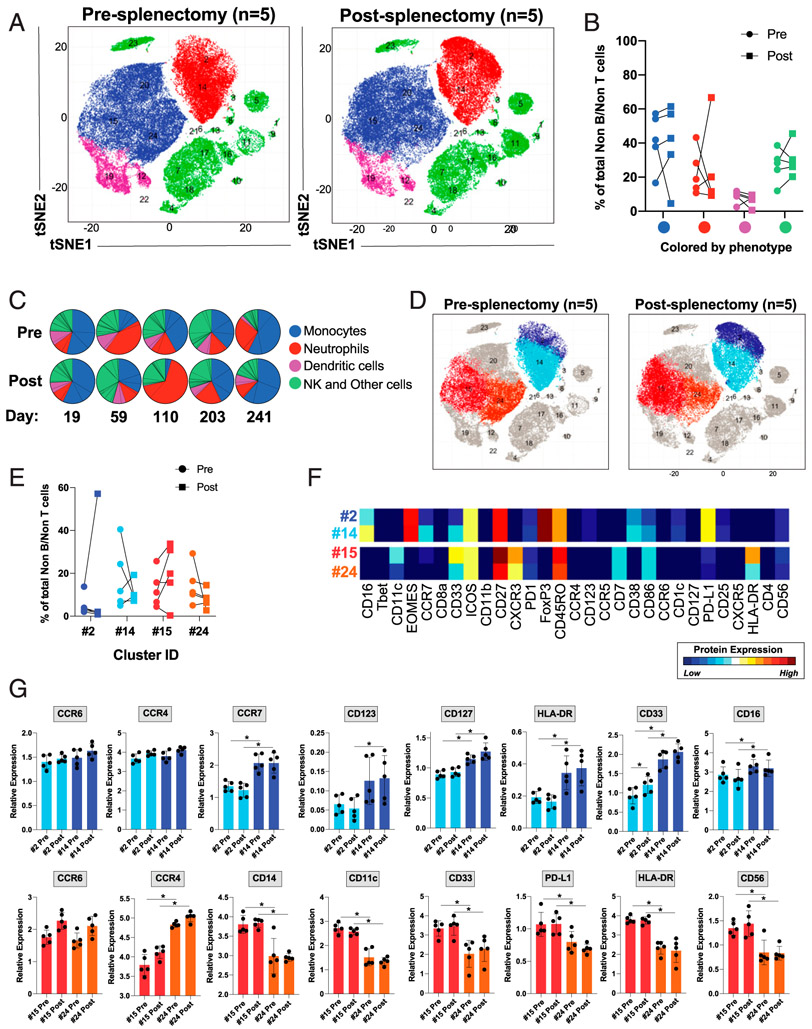
FIGURE 5. Splenectomy alters the frequency and activation of monocytes and neutrophils.
Mass cytometric analysis of lysed whole blood from patients before and after splenectomy. (C) The timing of the postsplenectomy blood draws from each patient. Files were normalized and gated on single CD45+CD3−CD19− cells prior to analysis. (A) PhenoGraph analysis focusing on CD45+CD3−CD19− myeloid cells, comparing pre- and postsplenectomy samples from all five patients, colored by cellular phenotype. (B) The frequencies of PhenoGraph-defined clusters comparing the values of each cell type between pre- and postsplenectomy samples from each patient. (C) Comparison of the frequencies of PhenoGraph-defined clusters between pre- and postsplenectomy samples from each patient, including the number of days postsplenectomy the blood draw occurred. (D and E) Identification of the populations with the greatest degree of change between pre- and postsplenectomy (cell populations were identified based on the markers in Supplemental Table III). (F) Dendrogram heatmap generated in Cytofkit depicting the differences in the expression of the designated proteins between clusters 2 and 14 or 15 and 24. (G) Quantification of the mean metal intensity (relative expression level) of the designated proteins compared between clusters 2 and 14 and between 15 and 24 from pre- and postsplenectomy samples. *p < 0.05.

