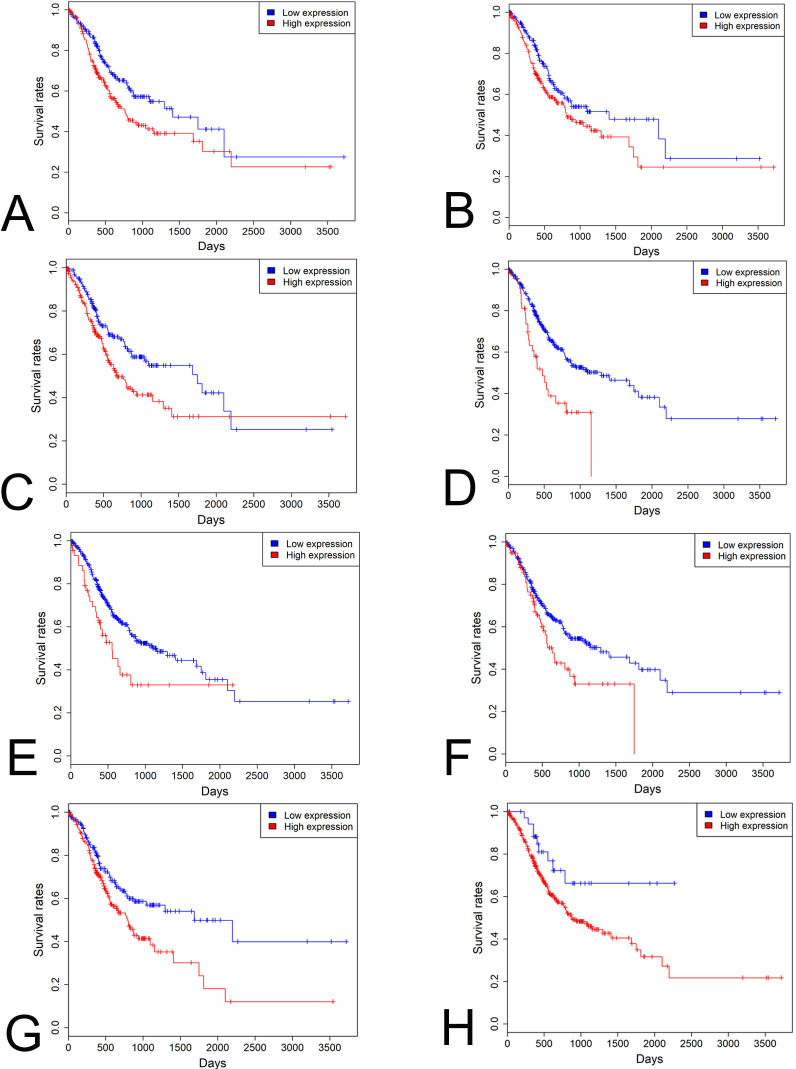
Figure 5.
Survival analysis of driver genes in STAD. High DNER (A), LHCGR (B), NLRP14 (C), OR4N2 (D), PSG6 (E), TTC29 (F), ZNF568 (G) expression levels and prognostic expression panel (H) was associated with poor prognosis in STAD patients. Red and blue curves represented high and low expression groups, respectively. STAD, stomach adenocarcinoma.

