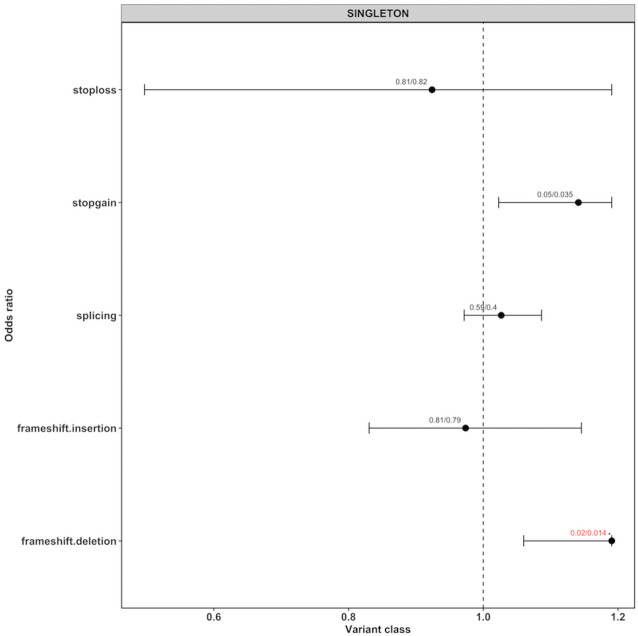
Figure 2.
ORs for singleton loss-of-function (LoF) variants for different variant types. Each dot represents the OR generated by the generalised linear model (glm) given with their 95% CIs (as horizontal lines, for LoF only the left part of the interval). The values on top of each point represents the corrected p value from the glm model (pglm) and the empirical p value (pemp) from the Wilcoxon rank-sum test, separated by ‘/’. If both the corrected p values were below 0.05, they are highlighted in red with an ‘*’ on top.

