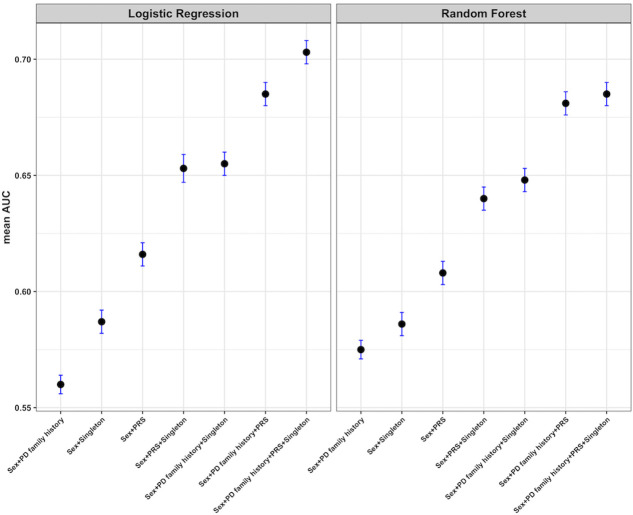
Figure 5.
Performance of different models for the prediction of Parkinson’s disease (PD) risk. The area under the curve (AUC) values (with 95% CIs) of seven models and two prediction models for the Parkinson’s Progression Markers Initiative dataset. Two predictors, logistic regression and random forest, were applied. PD family history, family history of PD up to first degree; PRS, polygenic risk score; Sex, reported gender; Singleton, singleton loss-of-function count per sample. The higher the mean AUC, the better the model. The reported AUC is a mean over 1000 repetitions on test sets randomly drawn with a 0.9 training–test split.

