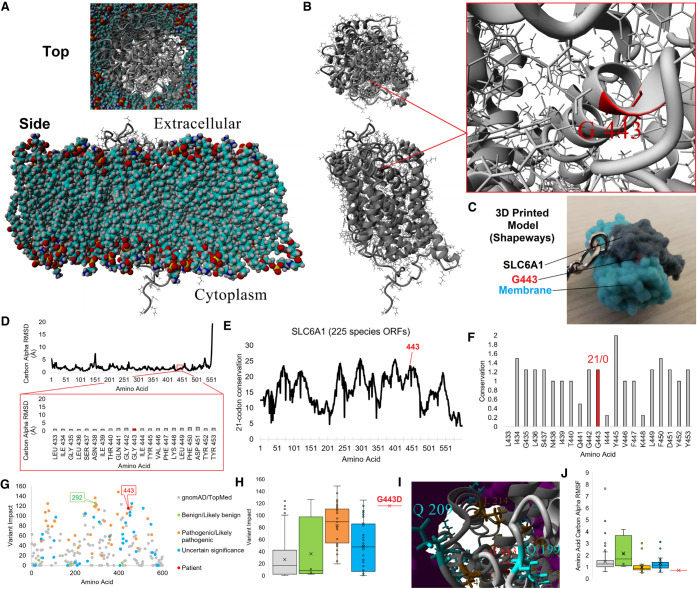
Figure 1.
SLC6A1 variant analysis. (A,B) Structural model of SLC6A1 (gray) in a lipid membrane (A, multicolored) or alone (B). The top represents a view of the protein from the extracellular surface, whereas the bottom is from a cross section of the membrane. On B, the G443 position is marked and the zoom-in view is provided on the right. (C) 3D printed model of G443 (red) on SLC6A1 (gray) with a cutout of the membrane (cyan) available at www.shapeways.com/product/AAUK2K5JU/slc6a1?li=marketplace&optionId=150795805. (D) Molecular dynamic simulation of the SLC6A1 protein model in A shown for the carbon α root mean squared deviation (RMSD) for each amino acid averaged throughout 18 nsec of simulation. These values provide quantitative values for amino acids well packed (low RMSD) and those found within loops with no atomic hindrance in movement, with most values of SLC6A1 here low, suggestive of a well-folded protein. The bottom red box is a zoom-in view of amino acid 443 region showing high stability of the structure. (E) Deep evolutionary analysis using 225 species open reading frame sequences for SLC6A1. The plot shows a sliding window calculation for each site (plus 10 upstream and downstream), identifying the most selected and conserved linear motifs within the gene. Amino acid 443 is identified in red. (F) Zoom-in view of conservation for amino acid 443 (red) linear motif. The numbers above represent the percent of sequences with synonymous/nonsynonymous variants throughout evolution. (G) Variant impact scoring for all TOPMed/gnomAD (gray), ClinVar (benign or likely benign in green, pathogenic or likely pathogenic in orange, VUS in cyan), and patient (red) variants for SLC6A1. (H) Box and whisker plot for each group plotted in G, with colors consistent within G–J. This shows that the value clustering for each ClinVar annotation was likely pathogenic, pathogenic values are seen elevated over gnomAD/TOPMed and benign annotation, and only a few VUSs score high including G443D in red. (I) Clustered 3D variants on SLC6A1 relative to the patients with the same colors as those labeled in H. The lipid membrane is shown in magenta. (J) Root mean squared fluctuation (RMSF) of variant groups. The values show the average movement of each amino acid throughout biochemical simulations in which benign and gnomAD/TOPMed variants have higher movement and all other groups (excluding a few VUSs and pathogenic variants) are low, suggestive of well-packed amino acids including G443D.

