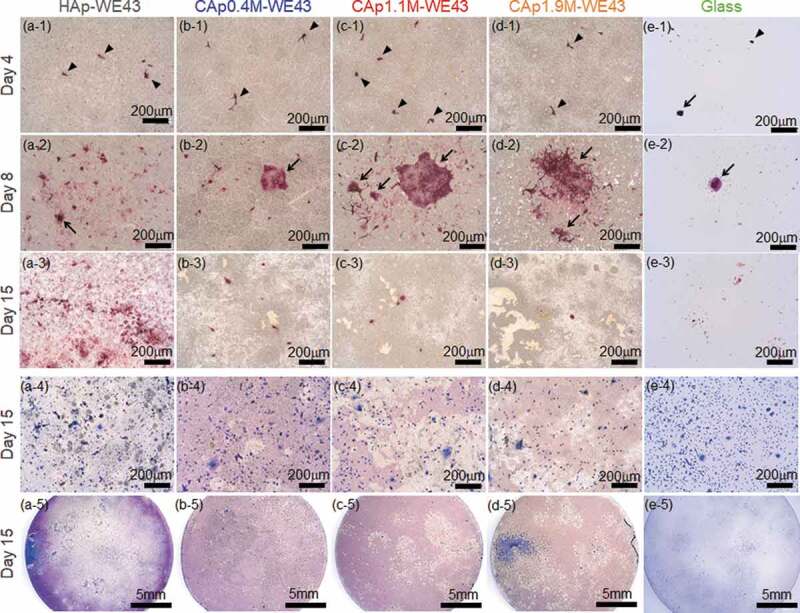
Figure 4.

Optical surface images of (a-1)–(a-5) HAp-WE43, (b-1)–(b-5) CAp0.4M-WE43, (c-1)–(c-5) CAp1.1M-WE43, (d-1)–(d-5) CAp1.9M-WE43 and (e-1)–(e-5) Glass with (a-1)–(e-3) TRAP-stained osteoclasts and (a-4)–(e-5) Giemsa-stained osteoclasts. Images on (a-1)–(e-1) Day 4, (a-2)–-(e-2) Day 8, (a-3)–(e-3) Day 15 with TRAP-stained cells. (a-4)–(e-4) images on Day 15 with Giemsa-stained cells. (a-5)–(e-5) whole surface images on Day15 with Giemsa-stained cells. Arrowheads and arrows indicate typical mononuclear and multinuclear osteoclasts, respectively.
