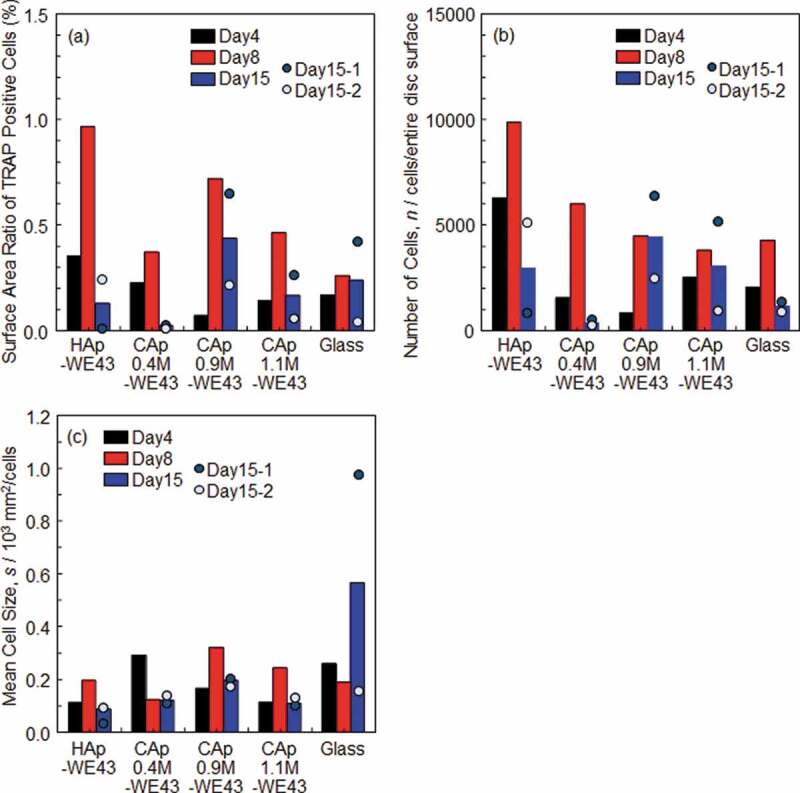
Figure 5.

(a) Ratio of the total surface area occupied with TRAP-positive cells to the entire surface area of disc specimens, (b) apparent number of TRAP-positive cells and (c) apparent mean cell size. n = 1 on Days 4 and 8 and n = 2 on Day 15. The bar graphs on Day 15 show the mean values of two samples indicated by plots. The areas of the entire disc surface of WE43 and glass discs were 201 mm2 and 314 mm2, respectively.
