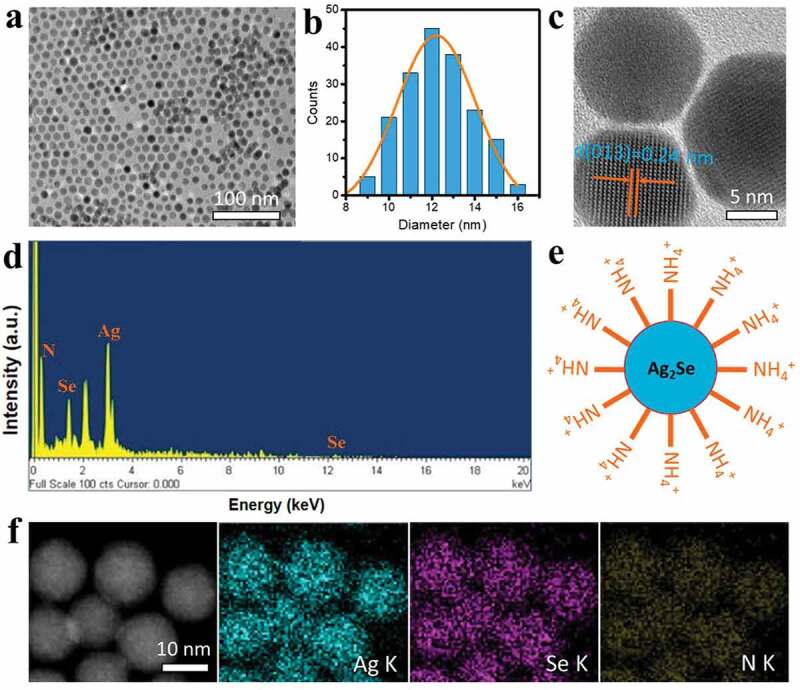
Figure 1.

TEM image (a), diameter distribution (b), high-resolution TEM image (c), and EDS spectrum (d) of CTAB-Ag2Se nanoparticles. (e) Illustration of CTAB-Ag2Se nanoparticles with exposed NH4+ group. (f) elemental maps of CTAB-Ag2Se nanoparticles.
