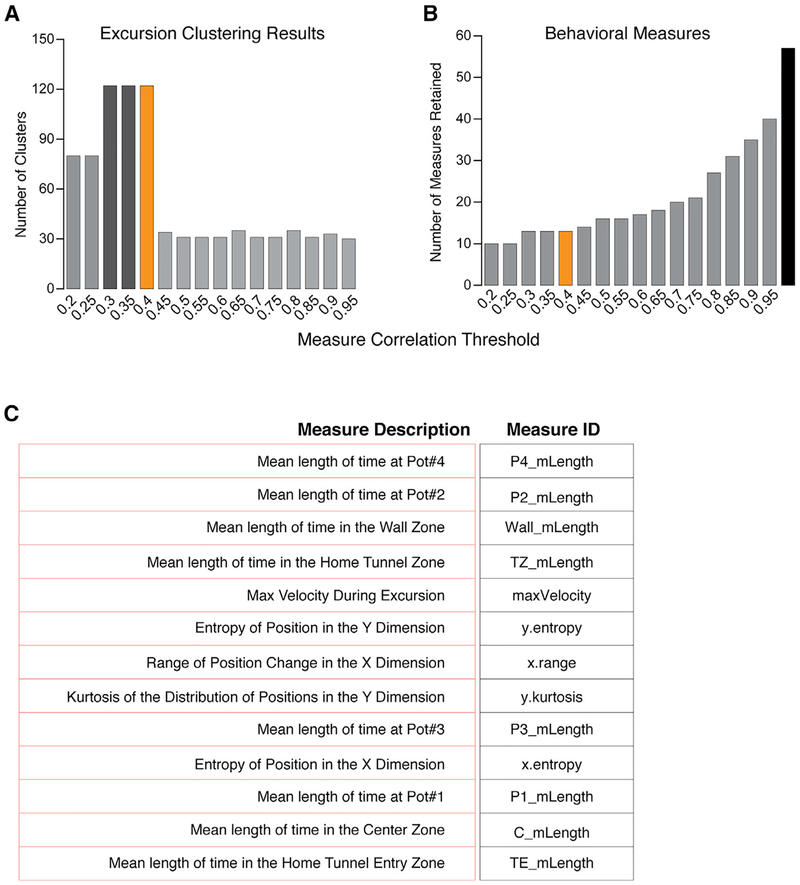
Figure 2. Identification of Behavioral Measures Best Resolving Candidate Modules from Foraging Patterns.
(A) The bar plot shows the number of excursion clusters detected by Dynamic Tree Cut from unsupervised hierarchical clustering (Ward) of the foraging excursions based on the retained measures at different correlation thresholds. A Pearson correlation threshold of r < 0.3 to 0.4 yields the best resolution of distinct clusters (candidate modules; r < 0.4 was selected for our study [orange bar]). More relaxed thresholds (r > 0.4) may reduce cluster detection due to redundant measures that mask the effect of other measures. Thresholds that are too stringent (r < 0.3) may reduce cluster detection by pruning informative measures.
(B and C) The bar plot shows the number of behavioral measures retained at different Pearson correlation thresholds (B). A total of 57 (black bar) measures are tested and the number retained at the selected threshold (r < 0.4) is 13 (orange bar).
(C) The identity of the 13 measures that best resolve excursion clusters (candidate modules) are shown.

