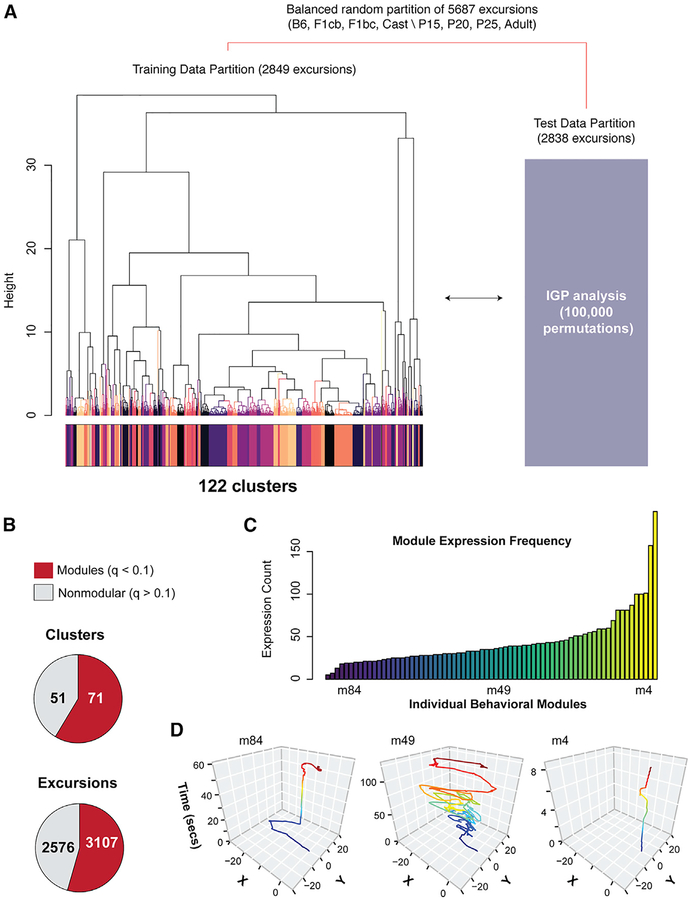
Figure 3. Discovery of 71 Significant Modules of Foraging Behavior across Different Ages and Strains of Mice.
(A) Details of the training and testing data partitions and approach to test for significant cluster reproducibility using the IGP permutation test. Unsupervised hierarchical clustering (Ward) and Dynamic Tree Cut analysis identified 122 clusters (colored track) in the training data. The centroids for each training data cluster are used in the IGP permutation test with the test data (100,000 permutations yielded over 5,000 permutations per cluster).
(B) Pie charts show the number of significantly reproducible training data clusters found by the IGP test. The data reveal 71 modules (q < 0.1, red), as well as nonmodular excursions (q > 0.1, gray). The number of excursions in each class is also shown.
(C) A histogram showing the frequency at which each module is expressed across all 191 mice tested. Some are relatively infrequently (e.g., module 84 [m84]), moderately frequently (e.g., module 49), or frequently (e.g., module 4) expressed.
(D) The plots show representative x-y traces of mouse movement over time (seconds) in the arena for examples of infrequently (module 84), moderately (module 49), and frequently (module 4) expressed modules. The traces track the center of the mouse’s body during the round-trip excursions, which start and end at the tunnel to the home (0,0). They are colored according to relative time. Different modules have different movement and temporal characters.

