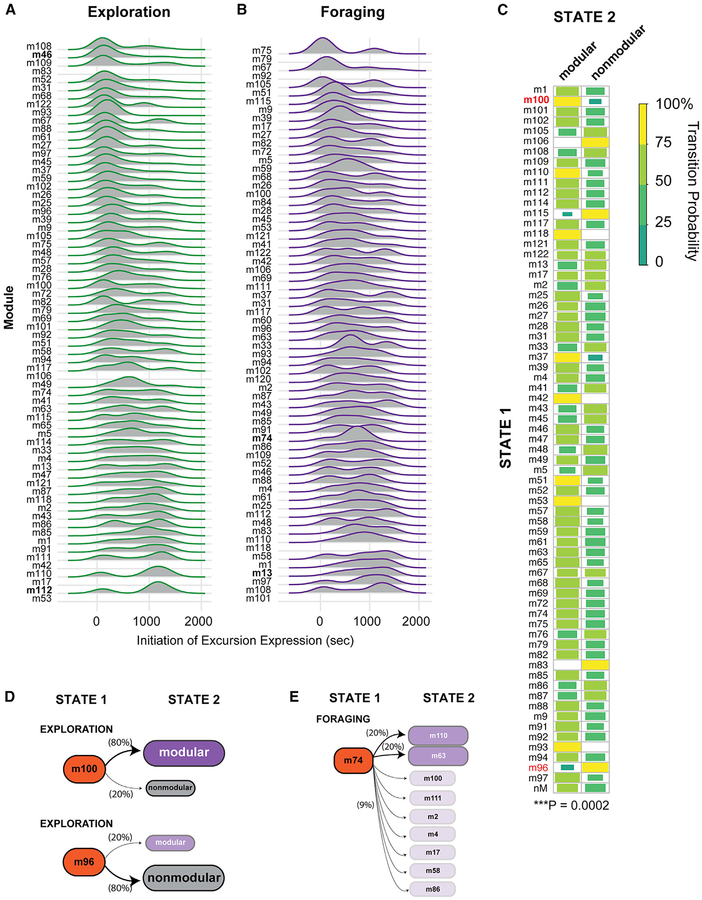
Figure 4. The Expression Order of Modular and Nonmodular Excursions Is Probabilistically Determined.
(A and B) Ridgeplots reveal the distribution of start times for excursions of different module types in the exploration (A) and foraging (B) phases relative to the beginning of the 25-min testing period (data are from all 191 study mice). Modules detailed in the main text are highlighted in bold.
(C) The chart shows the transition probabilities between specific modules (y axis, state 1) and modular versus nonmodular excursions (x axis, state 2) in the exploration phase. The plot is computed from a transition matrix of the number of times each transition type occurred across all 191 study mice. The transition to a modular versus nonmodular excursion (state 2) depends significantly on the type of module expressed (state 1) (Fisher’s exact test, p = 0.0002, two-sided test, Monte Carlo simulated p value). The strength of the transition probability is indicated by the size and shade of the box (see legend). If a box is not shown, then no association exists. Main text examples are highlighted in red.
(D) Transition probabilities for modular versus nonmodular excursions following expression of module 100 or module 96. Probabilities are shown in brackets.
(E) Transition probabilities of different modules following expression of module 74 in the foraging phase. Transitions to specific modules occur in probabilistically determined manner (Data S1 and S2). Dark purple modules, 20% probability; light purple modules, 9% probability.

