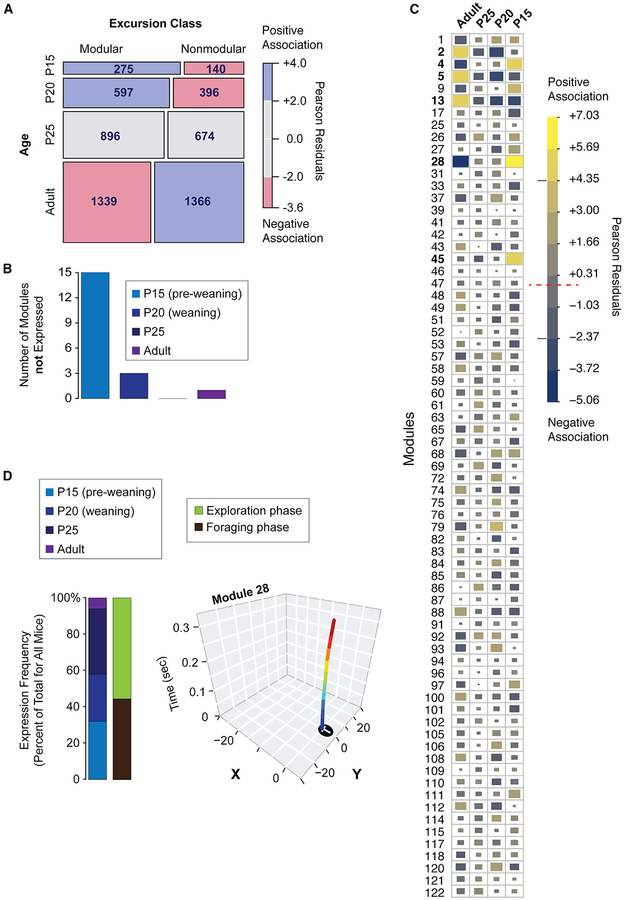
Figure 6. Module Expression Develops in a Stereotyped Manner in Offspring.
(A) A mosaic plot depicting a table of the numbers of modular and nonmodular excursions expressed at different ages. A chi-square test indicates that the relative expression of modular versus nonmodular excursions is dependent on age (p = 1.7 × 10⁻¹⁴). The mosaic plot boxes are scaled according to the relative numbers of excursions and colored according to positive (blue) and negative (red) associations between the rows and columns based on the Pearson residuals. P15 and P20 juveniles are positively associated with modular excursions, while adulthood is associated with relatively more nonmodular excursions. n = 20 adult, n = 16 P25, n = 15 P20, n = 16 P15.
(B) Bar plot shows the number of modules that are not detected at different ages across all of the mouse strains tested. Some modules emerge at specific ages.
(C) The chart shows the top modules impacted by age differences. Pearson residuals computed from a chi-square test are shown for module expression frequency data. The data show modules with expression frequencies that are positively (yellow) or negatively (blue) associated with each age. Relative effect size is depicted by color (see legend) and block size. The red dashed line in the legend shows the threshold at which the observed and expected module expression counts are the same (Pearson residuals equal zero). The gray lines show the threshold for the top age affected modules (bolded modules).
(D) Stacked bar plots show the relative expression frequency of module 28 by age and phase (exploration, green; Foraging, brown). Representative x-y tracks for excursions for module 28 are shown. Module 28 is expressed predominantly by juveniles, not adults, and in both phases.

