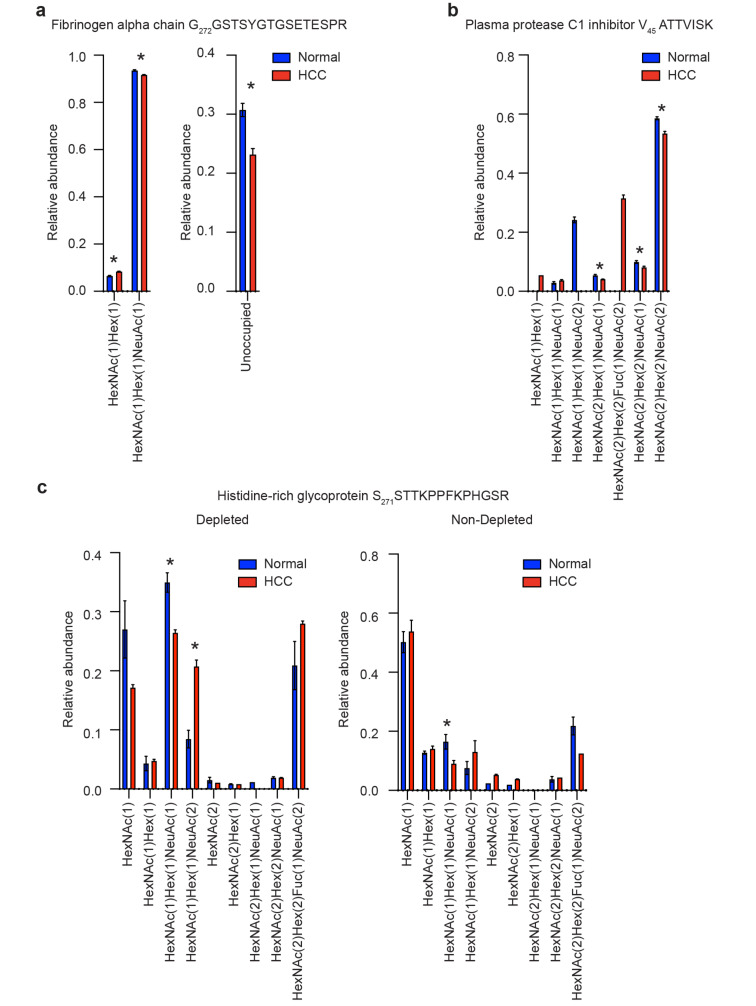
Figure 5.
Peptide-specific O-glycosylation profiling with GlypNirO. Peptide-specific relative glycoform abundance in HCC patients and healthy controls on (a) fibrinogen alpha chain G272GSTSYGTGSETESPR, (b) plasma protease C1 inhibitor V45AATVISK, and (c) histidine-rich glycoprotein S271STTKPPFKPHGSR. N = 3; values show mean; error bars show standard error of the mean; *, P < 0.05.

