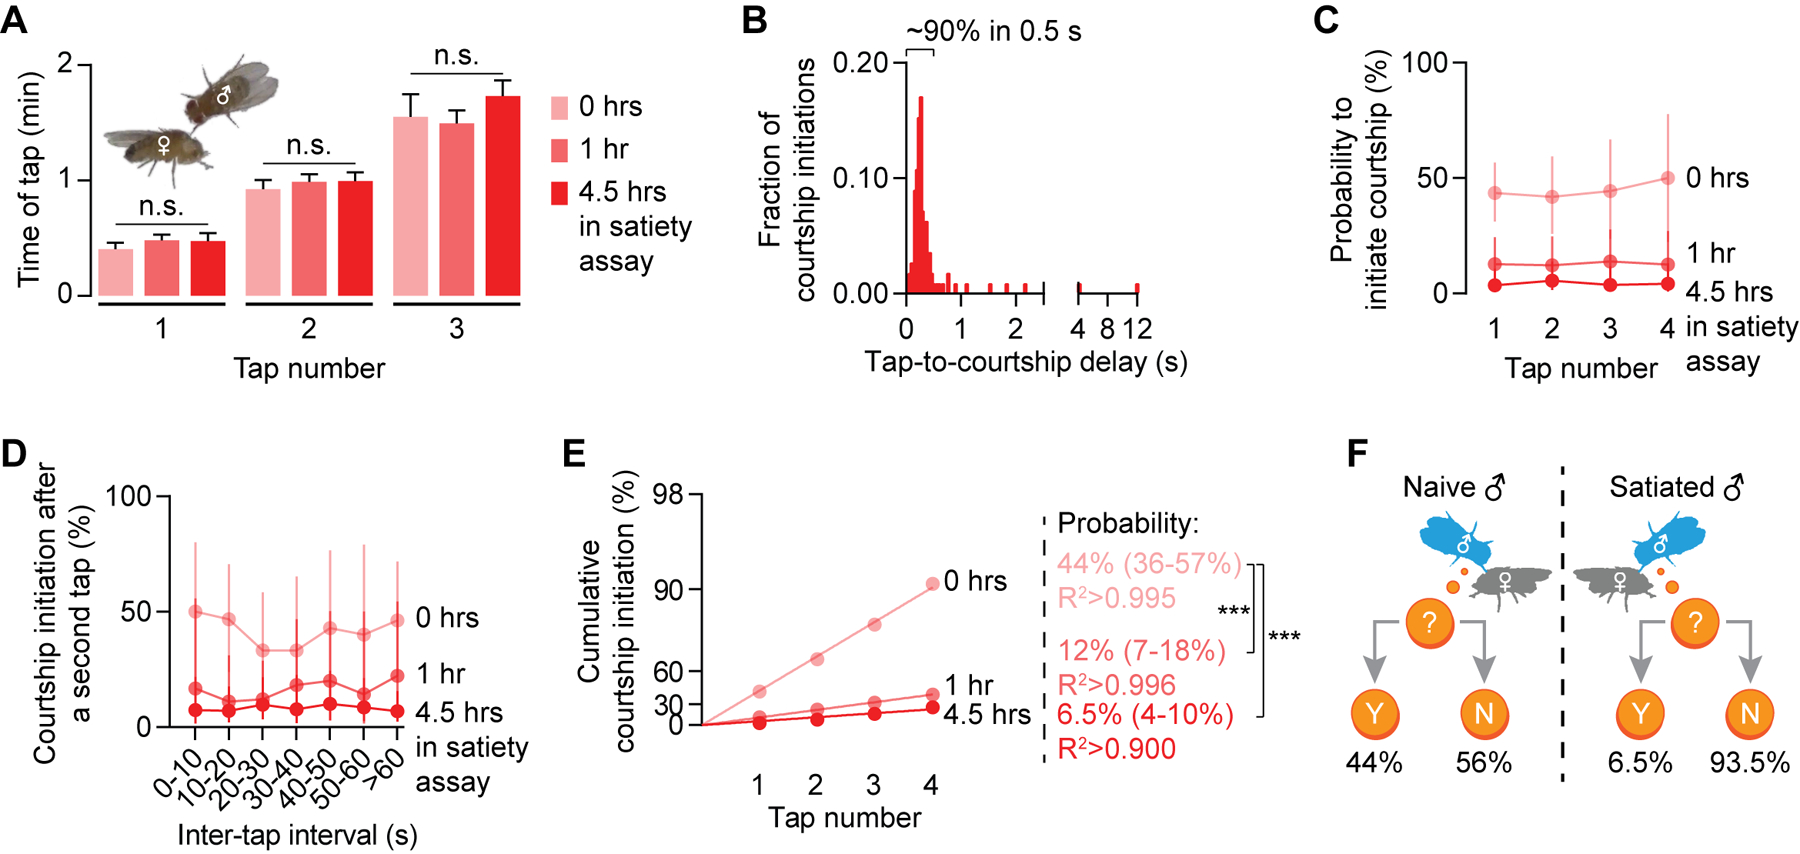
Figure 1. A coin-flip model describes courtship initiation probability.

(A) The tapping frequency over the first several minutes in a courtship assay is consistent from tap to tap and does not change with satiety state (see STAR Methods) (one-way ANOVA†, n = 47–57 males). (B) Courtship is always preceded by a tap (n = 112 initiations). See Movies S1–S3. (C-D) The per-tap probability to initiate courtship scales with satiety state but is consistent from tap to tap (C) and is independent of the inter-tap interval (D) (Mean ± 95% C.I., n = 47–57 males). (E) For each satiety state, the cumulative courtship initiation probability curve linearizes on a modified log-scaled Y-axis suitable for coin-flip models (See STAR Methods). The courtship probabilities are calculated from the slopes of the linear fits (95% C.I. are in parentheses; bootstrap, n = 47–57 males; see details for bootstrapping in STAR Methods). (F) Motivation sets the probability that a tap will trigger courtship. In all figures, *p<0.05, **p<0.01, ***p<0.001, n.s. not significant for all statistical tests. See Table S1 for all estimated courtship probabilities and Table S2 for genotypes and the numbers of animals for each experiment.
