
Figure 3. Dopamine desensitizes P1 to inhibition.
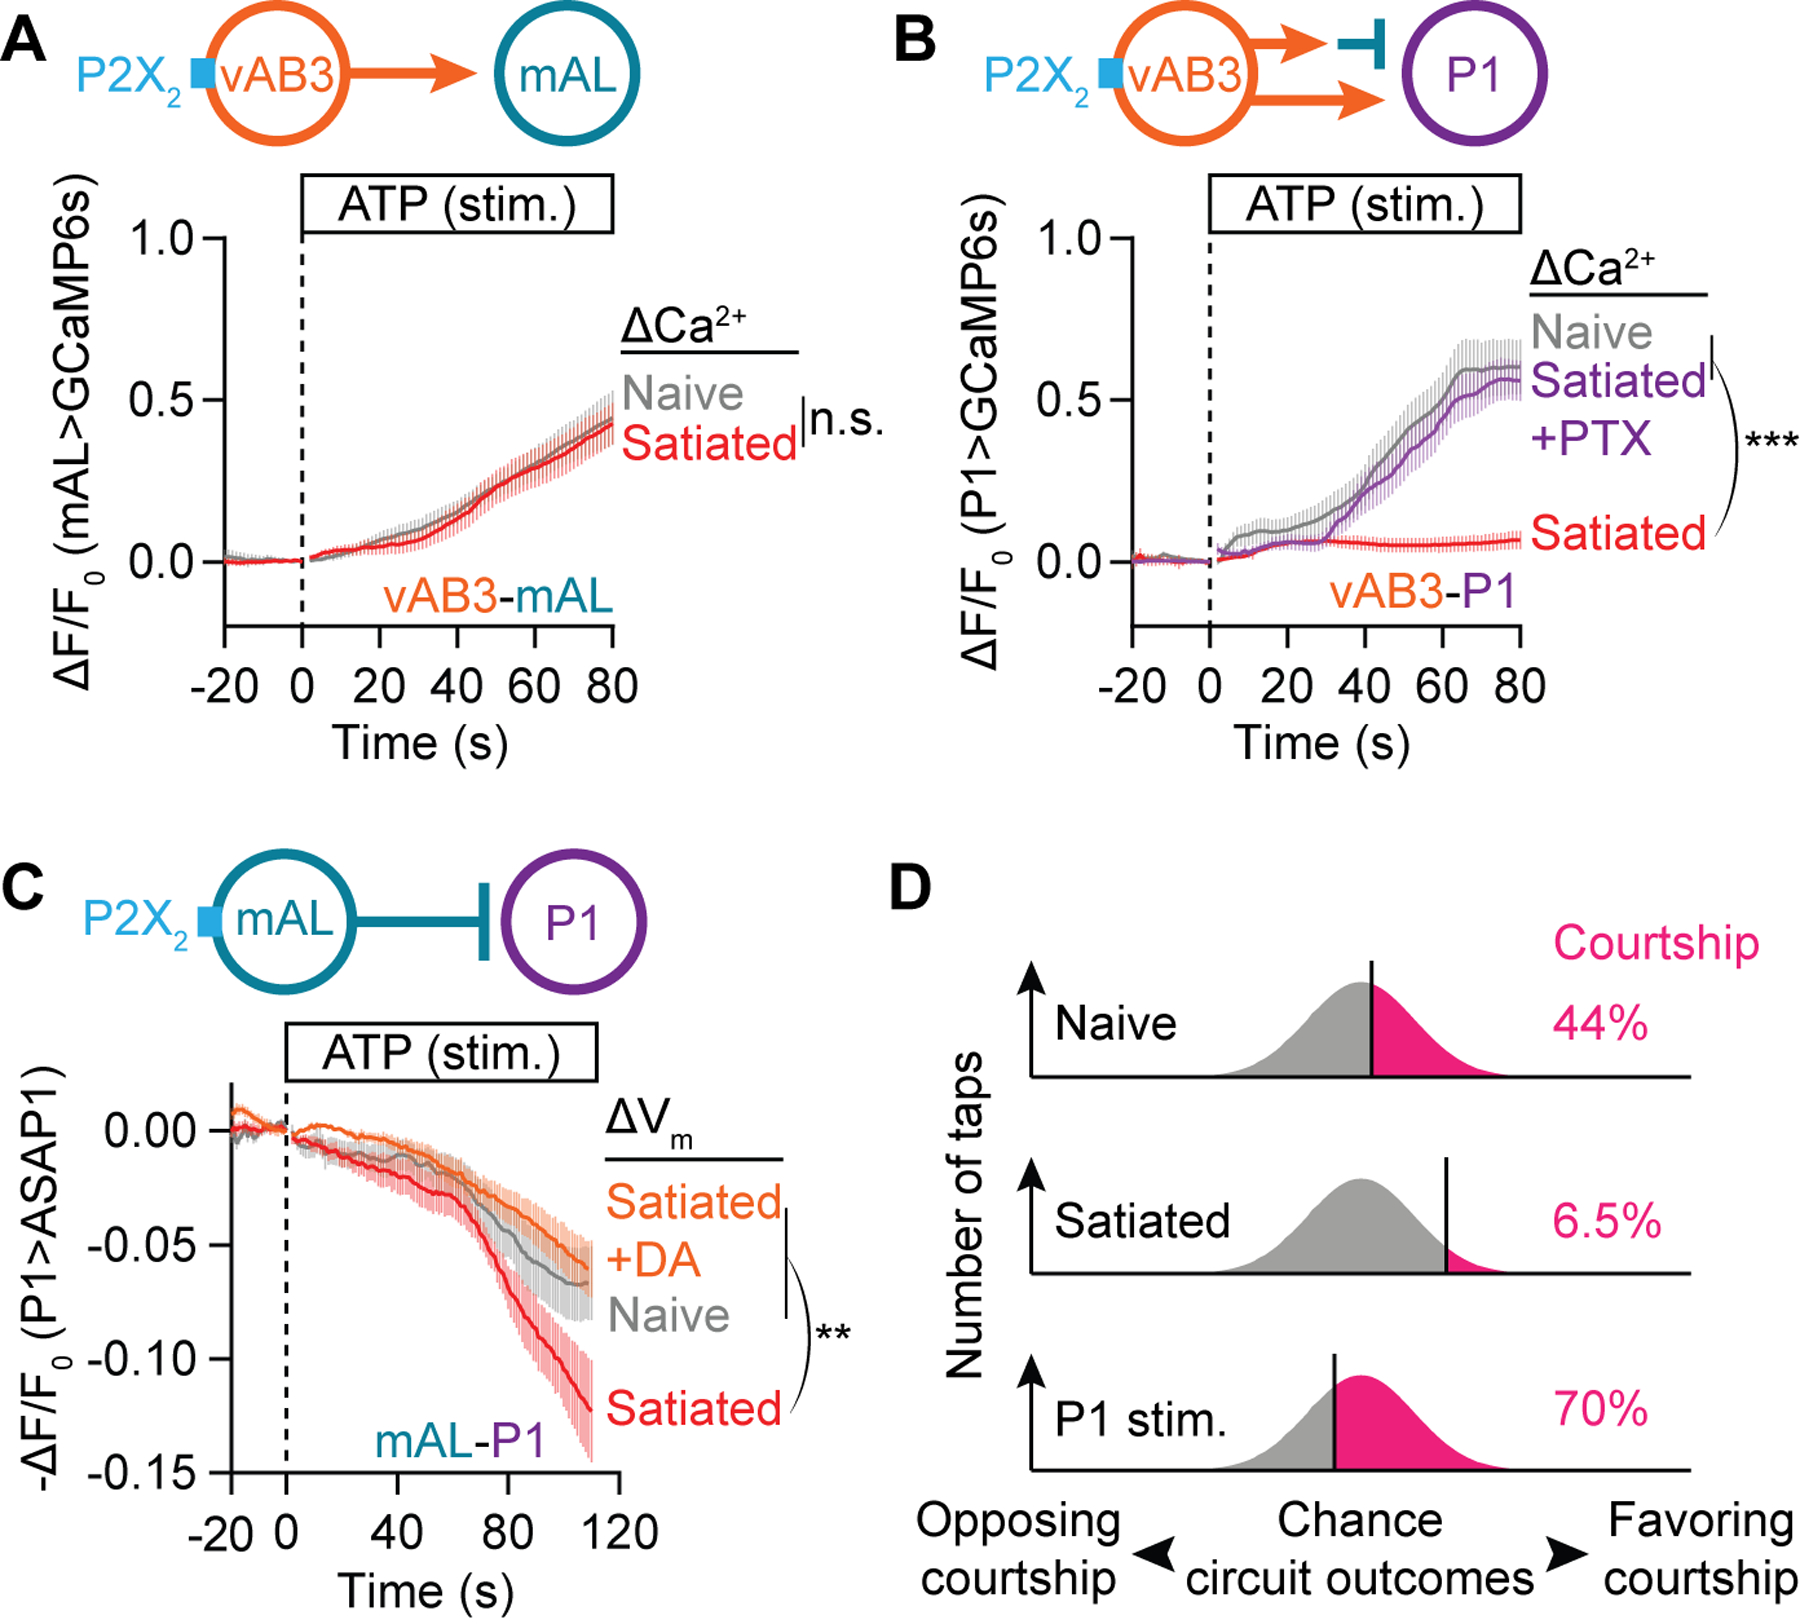
(A) P2X2 stimulation (Lima and Miesenböck, 2005) of vAB3 axons evokes the same calcium response in mAL neurons from naïve and 4.5-hour satiated males (t-test of max ΔF/F0, Mean ± S.E.M., n = 12–13 brains). See Figure S5C for subsequent KCl stimulation which shows these neurons to be healthy. (B) P2X2 stimulation of vAB3 axons evokes a strong calcium response in P1-B neurons only in brains dissected from naïve (gray) but not 4.5-hour satiated males (red). A strong calcium response is recovered in satiated brains by pre-applying 100 μM GABAA blocker picrotoxin for 10 minutes before ATP stimulation (purple) (one-way ANOVA of max ΔF/F0, Mean ± S.E.M., n = 14–15 brains). See Figure S5D for subsequent KCl stimulation. (C) P2X2 stimulation of mAL neurons hyperpolarizes P1 neurons, as indicated by an increase in the fluorescence (decrease in -ΔF/F0) of the ASAP1 voltage sensor. This hyperpolarization is more pronounced in brains dissected from 4.5-hour satiated males (red) than from naïve males (gray). The increased sensitivity to mAL stimulation in satiated brains is reverted by pre-applying 100 μM dopamine for 10 minutes before ATP stimulation (orange) (one-way ANOVA of min -ΔF/F0, Mean ± S.E.M., n = 8–9 brains). In this and subsequent voltage-imaging plots, fluorescence changes are plotted on a −ΔF/F0 scale to correct for the inverse relation between membrane voltage and sensor fluorescence (St-Pierre et al., 2014). (D) Motivation and P1 stimulation shift the fraction of taps that generate excitation/inhibition ratios sufficient to trigger courtship.