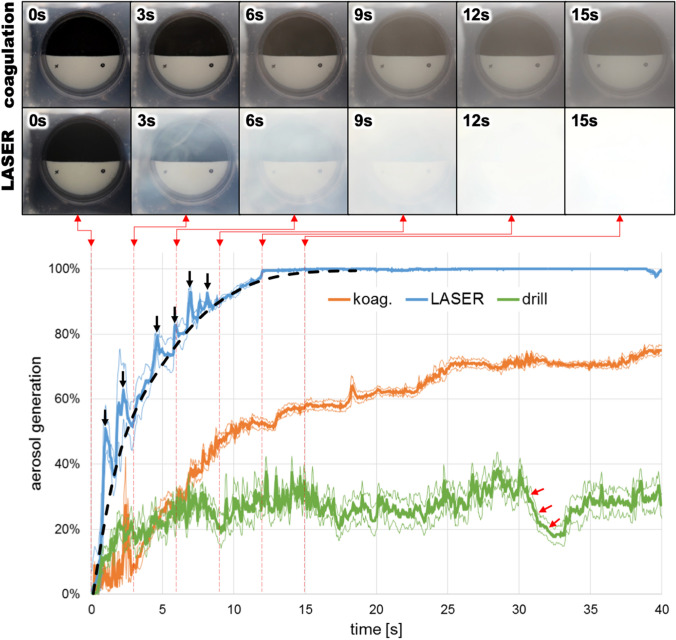
Fig. 4.
Evaluation of aerosol formation: The faster and more intensive aerosol formation by the laser compared to electrocauterization is clearly visible in the direct comparison of the individual images. The spikes in the graph beyond the dotted trend line (black arrow markings) are caused by rising plumes of smoke at the beginning of the laser treatment. Nebulisation during drilling is not caused by flue gas, but by spraying the finest droplets of the rinsing liquid. The rapid sinking of the fog during a short drilling pause (red arrows) is clearly visible; aerosol from coagulation or laser would be in the air until the sample chamber is sucked out or aired

