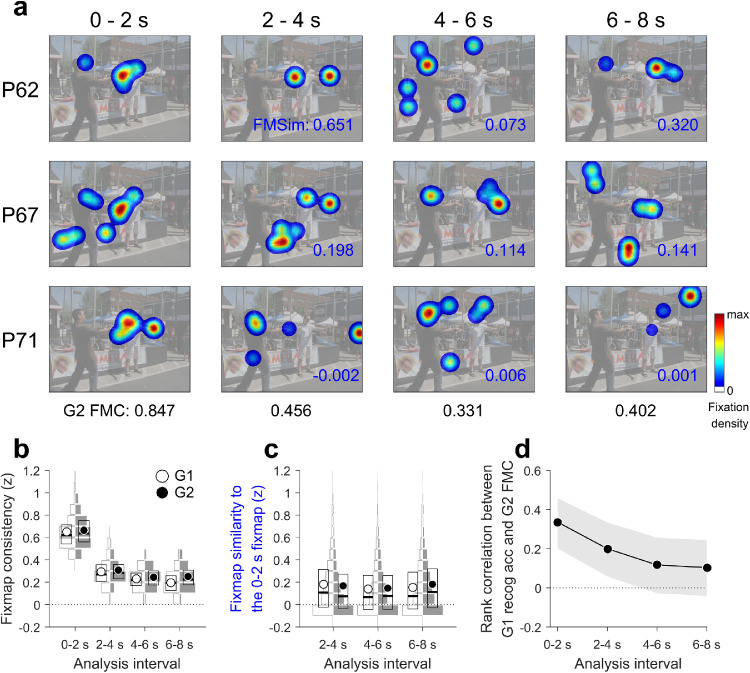
Figure 6.
Examination of attention deployment across time in the Edinburgh dataset. (a) Three exemplar G2 participants’ fixation maps at each 2-second intervals. The black numbers at the bottom are fixation map consistency (FMC). The blue numbers on the left bottom of each fixation map are fixation map similarity (FMSim) between the current fixation map and the fixation map from 0 to 2 seconds. Note that FMC is calculated across participants, whereas FMSim is calculated within the same participant. (b) FMC across time. The unit of analysis is scene. The histograms of G1 and G2 FMC are drawn, and the rectangles are overlaid to describe their median, first, and third quartiles. The upper and lower horizontal edges of the rectangles specify the first and third quartile, the middle thick lines specify the median, and the open and filled circles represent the mean. (c) FMSim across time. The unit of analysis is trial (a participant seeing a scene), thus the FMSim ranges are larger. However, the majority of FMSim values are around 0, and the mean is around 0.2. (d) Rank correlations between G1 recognition accuracy and G2 FMC across time. The gray shades represent the 95% confidence intervals.

