Figure 3.

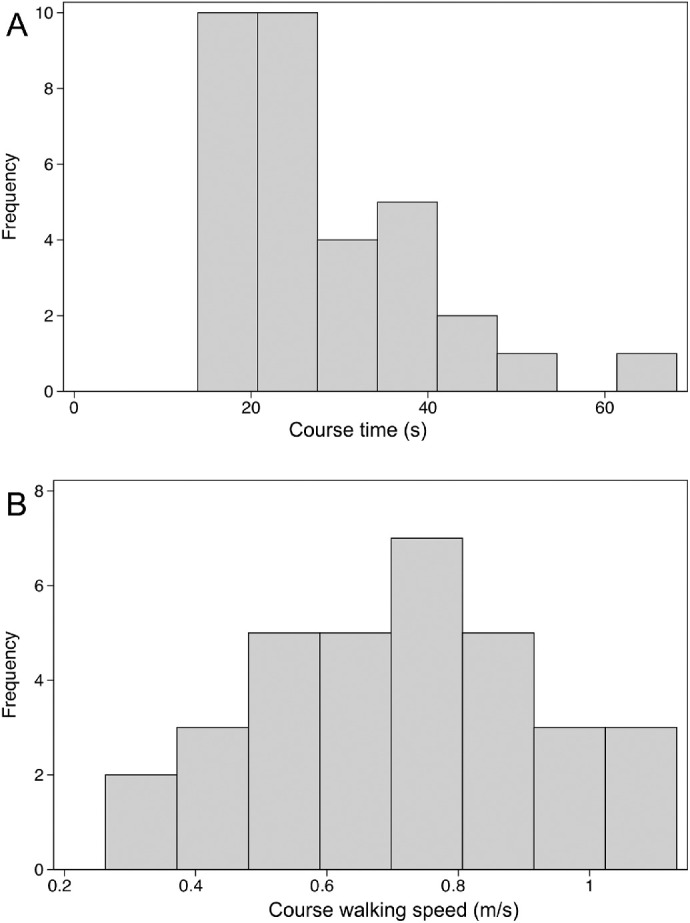
Histograms showing distribution of course time (A) and walking speed (B) in right eyes of affected subjects. Course time shows a skewed distribution which is largely corrected for by converting course time into walking speed.

Histograms showing distribution of course time (A) and walking speed (B) in right eyes of affected subjects. Course time shows a skewed distribution which is largely corrected for by converting course time into walking speed.