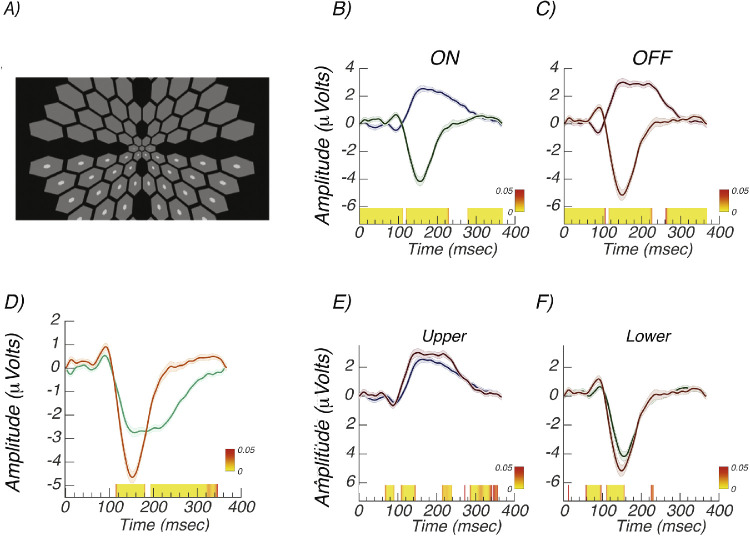
Figure 7.
Experiment 4: Upper versus lower field responses. (A) Schematic illustration of lower field increment test configuration. The pedestals were always presented in both hemifields, but probes were presented in only one. Both increments and decrements were tested. (B) Increment/ON responses from upper (gray) and lower (black) visual fields are polarity inverted. (C) Decrement/OFF responses from upper (gray) and lower (black) visual fields are polarity inverted. (D) Comparison of upper (green) and lower field (orange) responses, pooled over contrast polarity. The polarity of the upper field responses has been inverted. (E) Comparison of increment/ON (gray) versus decrement/OFF (black) responses in the upper visual field. (F) Comparison of increment/ON (gray) versus decrement/OFF (black) responses in the lower visual field. Error bands are ±1 SEM.

