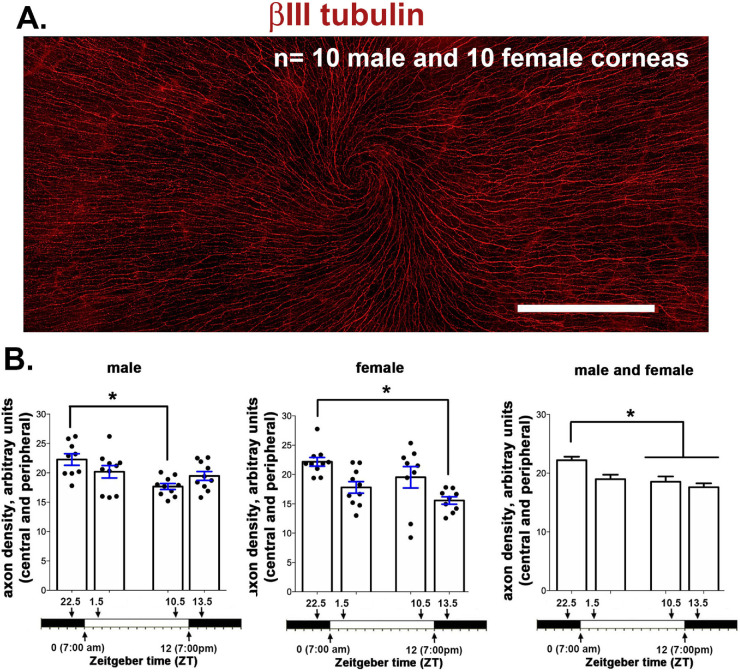
Figure 8.
Axon density, assessed by Sholl analysis, also varies as function of time. (A) Representative image taken of a female cornea from a mouse sacrificed at ZT 10.5. The cornea was stained with antibodies against βIII tubulin to reveal the ICNs. Each cornea was imaged using a spinning disk microscope with 7 × 3 individual images stitched together as described in the methods section. Scale bar: 500 µm. (B) Axon density was assessed in 10 male and 10 female mice at ZT 22.5, ZT 1.5, ZT 10.5, and ZT 13.5 using Sholl analysis. The data shown were obtained by assessing axon density at four sites at the corneal periphery and three sites in the corneal center for males and females and after combining data from both sexes. Axon density is maximal at ZT 22.5 and lower 90 min before and 90 min after lights are turned off. In both sexes, axon density is greatest at ZT 22.5 and lowest between ZT 1.5 and ZT 13.5.

