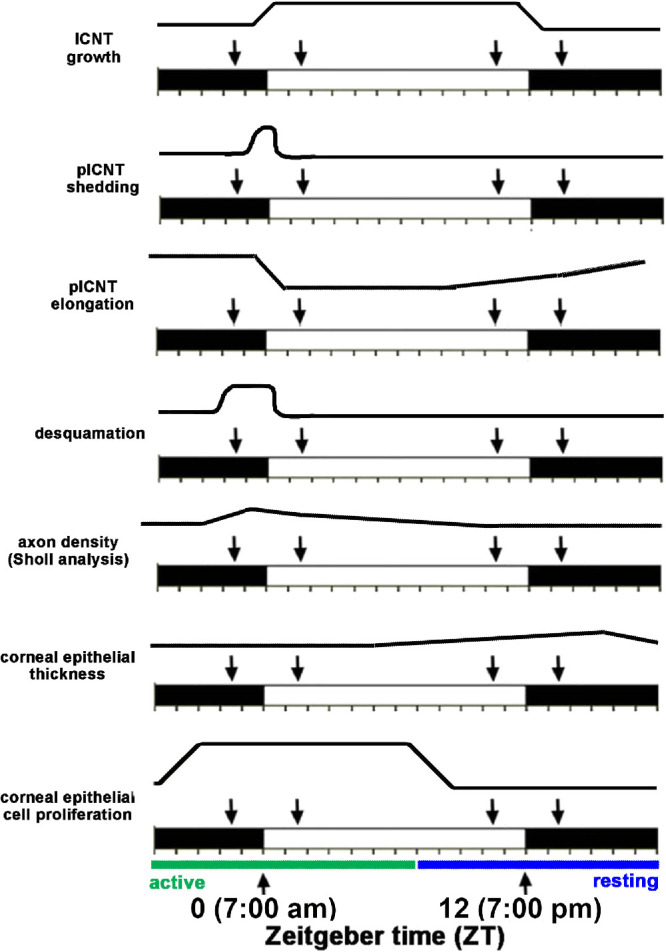
Figure 9.

Summary of the changes in the mouse cornea and its nerves that vary over time. The Zeitgeber scale is shown. The white area indicates when lights are on and the black area when lights are turned off. In these studies, lights are turned on at ZT 0 and off at ZT 12. We evaluated corneas 90 minutes before and 90 minutes after lights were turned on and off; those time points are indicated by the arrows.
